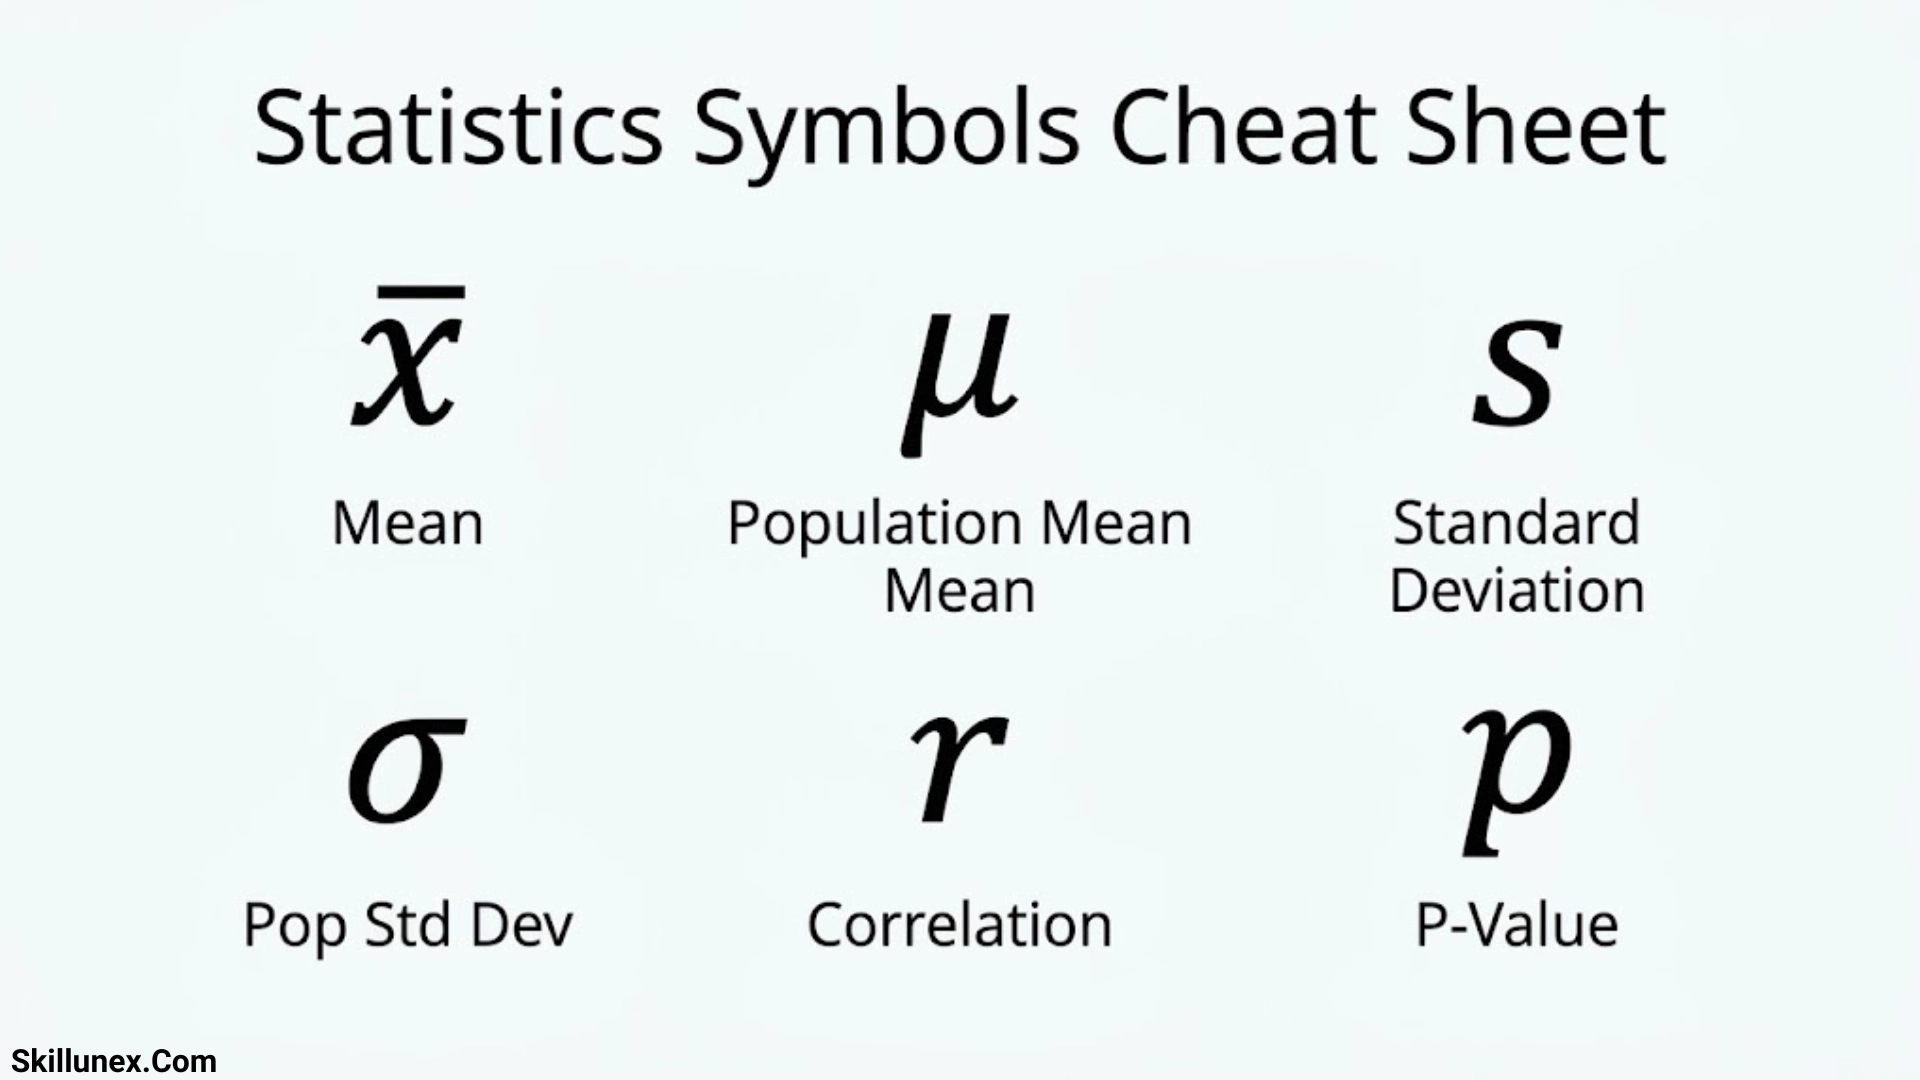
Statistics symbols can seem confusing when you first study statistics, probability, or data analysis. A statistics symbols cheat sheet helps you understand important symbols such as mean, standard deviation, variance, and probability without wasting time searching for their meanings. If you are a student or learning statistics, you can use this guide as a quick reference.
When you solve statistical problems, you may come across symbols like μ, σ, x̄, p, and n. Each symbol has a specific meaning and helps you understand formulas and calculations. With this statistics symbols cheat sheet, you can quickly learn what these symbols represent and how to use them in your studies, homework, or exams.
In this guide, you will find common statistical symbols, their meanings, and simple explanations to make learning easier. Whether you are a beginner or reviewing concepts for an upcoming test, you can use this cheat sheet to improve your understanding, avoid common mistakes, and solve statistics problems with greater confidence.
Quick Statistics Symbols Cheat Sheet
The following table covers the statistical symbols you’re most likely to encounter in introductory statistics, probability, and data analysis.
| Symbol | Name | Meaning |
| (n) | Sample Size | Number of observations in a sample |
| (N) | Population Size | Total number of members in a population |
| (x) | Data Value | An individual observation |
| (\bar{x}) | Sample Mean | Average of sample values |
| (\mu) | Population Mean | Average of all population values |
| (M) or (\tilde{x}) | Median | Middle value in ordered data; notation varies |
| (Mo) | Mode | Most frequently occurring value; notation varies |
| (s) | Sample Standard Deviation | Measures the spread of sample values |
| (\sigma) | Population Standard Deviation | Measures the spread of population values |
| (s^2) | Sample Variance | Sample variability expressed as squared deviations |
| (\sigma^2) | Population Variance | Population variability expressed as squared deviations |
| (R) | Range | Difference between the maximum and minimum values |
| (IQR) | Interquartile Range | Difference between the third and first quartiles |
| (\sum) | Summation | Adds a series of values |
| (p) | Population Proportion | Proportion of a population with a particular characteristic |
| (\hat{p}) | Sample Proportion | Proportion of a sample with a particular characteristic |
| (P(A)) | Probability | Probability that event (A) occurs |
| (E(X)) | Expected Value | Long-run average value of a random variable |
| (\operatorname{Var}(X)) | Variance | Measures the variability of a random variable |
| (r) | Sample Correlation | Measures the direction and strength of a linear relationship |
| (\rho) | Population Correlation | Population correlation coefficient |
| (SE) | Standard Error | Measures the estimated variability of a statistic |
| (CI) | Confidence Interval | Interval estimate for a population parameter |
| (H_0) | Null Hypothesis | Hypothesis tested against the evidence |
| (H_a) | Alternative Hypothesis | Hypothesis that competes with the null hypothesis |
| (\alpha) | Significance Level | Prespecified threshold for a statistical test |
| (df) | Degrees of Freedom | Number of independent pieces of information available in a calculation |
| (z) | Z-Score or Z-Statistic | Standardized value or test statistic, depending on context |
| (t) | T Statistic | Test statistic often used for inference about means |
| (\chi^2) | Chi-Square Statistic | Statistic used in several categorical-data tests |
| (F) | F-Statistic | Statistic used in variance comparisons and regression tests |
| (R^2) | Coefficient of Determination | Proportion of observed variation explained by a fitted model |
Basic Statistics Symbols and Their Meanings
Basic statistical notation describes individual observations, sample sizes, frequencies, and mathematical operations. These symbols appear in many formulas, so it’s helpful to learn them before moving to more advanced topics.
| Symbol | Meaning | Example |
| (x) | Individual data value | (x=8) |
| (x_i) | The (i)-th observation | (x_3=12) means the third observation is 12 |
| (X) | Random variable | Represents a variable with possible outcomes |
| (y) | Value of another variable | (y=15) |
| (n) | Number of sample observations | A sample containing 40 people has (n=40) |
| (N) | Total population size | A population containing 1,000 people has (N=1000) |
| (f) | Frequency | Number of times a value occurs |
| (f_i) | Frequency of a category or value | Count for category (i) |
| (k) | Number of categories or groups | Five categories means (k=5) |
| (\sum) | Summation | Adds all specified observations |
| (\prod) | Product notation | Multiplies a sequence of values |
| (\Delta) | Change or difference | (\Delta x=x_2-x_1) |
| (\approx) | Approximately equal to | (3.14\approx\pi) |
| (\propto) | Proportional to | Indicates that two quantities vary proportionally |
| (\in) | Element of a set | (x\in A) means (x) belongs to set (A) |
Xi Symbol in Statistics
The symbol xi, read as “x sub i,” represents the i-th observation or data value in a dataset. The letter x identifies the variable, while the subscript i identifies the position of a particular observation.
For example, suppose you have the following dataset:
2, 4, 6, 8, 10
You can label its values as follows:
- x1=2: the first observation.
- x2=4: the second observation.
- x3=6: the third observation.
- x4=8: the fourth observation.
- x5=10: the fifth observation.
The subscript i is an index. It can take different integer values, such as 1, 2, 3, and so on, depending on the observation being referenced.
The notation xi is useful in statistical formulas because it allows you to describe every value in a dataset without writing each value separately.
For example, the sample mean is commonly written as:
x=1ni=1nxi
This formula means that you add all n observations and divide their total by the number of observations.
It is also important to distinguish xi from the Greek letter (xi). The notation xi uses the Latin letter x with a subscript, whereas is a separate Greek character that may represent a random variable or another quantity in certain statistical texts. Their meanings depend on the notation used in the specific context.
Sx Symbol in Statistics
The symbol Sx, sx, or sometimes simply s can be used in statistics to represent the sample standard deviation of a variable x. However, statistical notation is not completely universal, so you should check how your textbook or formula defines the symbol.
The sample standard deviation describes how spread out the observations are around their sample mean. A small standard deviation means that the values are relatively close to the mean, while a large standard deviation indicates greater variation.
The sample standard deviation is commonly calculated using this formula:
s=i=1n(xi-x)2n-1
In this formula:
- s represents the sample standard deviation.
- xi represents each individual observation.
- x represents the sample mean.
- n represents the number of observations.
- means to add all the squared differences.
For example, consider the dataset 2, 4, and 6. Its sample mean is 4. The squared differences from the mean are 4, 0, and 4. Their sum is 8, so the sample variance is 8/(3-1)=4, and the sample standard deviation is s=4=2.
If your formula uses sx, it may mean the sample standard deviation specifically associated with variable x. Always follow the definition provided in your statistical material.
How to Read Summation Notation
The symbol (\sum) tells you to add a series of values. For example:
[
\sum_{i=1}^{4}x_i=x_1+x_2+x_3+x_4
]
If your observations are 2, 4, 6, and 8, then:
[
\sum_{i=1}^{4}x_i=2+4+6+8=20
]
The lower index identifies where the addition begins, while the upper index identifies where it ends.
Mean, Median, and Mode Symbols
Measures of central tendency describe the center of a dataset. The mean, median, and mode each summarize the data in a different way.
| Symbol | Statistical Measure | Meaning |
| (\bar{x}) | Sample Mean | Arithmetic average of sample observations |
| (\mu) | Population Mean | Arithmetic average of all population observations |
| (M) or (\tilde{x}) | Median | Middle value after sorting observations |
| (Mo) | Mode | Most frequently occurring value |
| (\bar{x}_w) | Weighted Mean | Average that accounts for different weights |
Sample Mean and Population Mean
The sample mean represents the average of observations collected from a sample. The population mean represents the average of every value in the population being studied.
The sample mean formula is:
[
\bar{x}=\frac{\sum_{i=1}^{n}x_i}{n}
]
The population mean formula is:
[
\mu=\frac{\sum_{i=1}^{N}x_i}{N}
]
For example, consider the values 4, 6, 8, 10, and 12.
[
\bar{x}=\frac{4+6+8+10+12}{5}=8
]
The sample mean is 8. If these five values represent the entire population, the population mean is also 8.
Median, Mode, and Weighted Mean
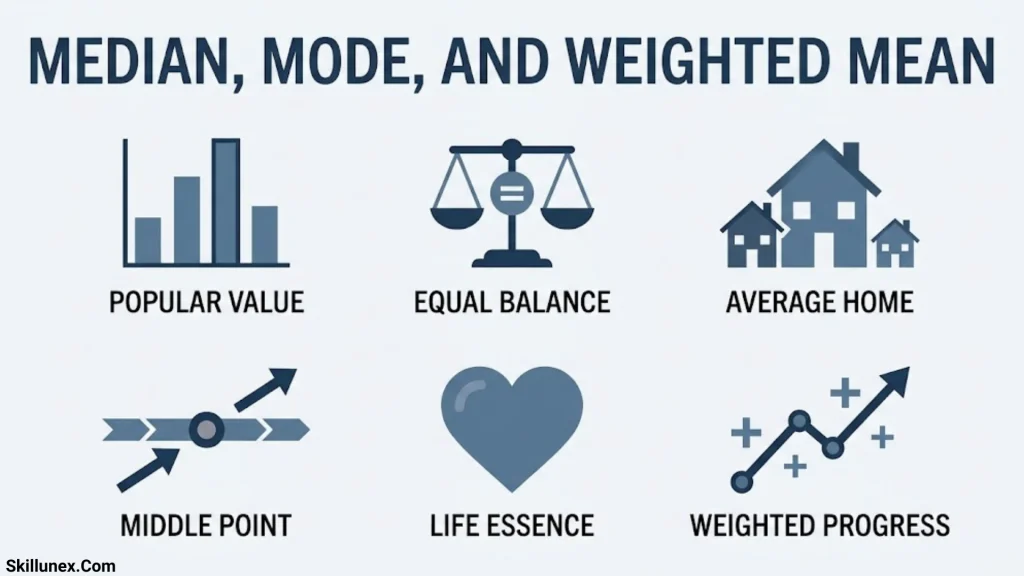
The median is the middle observation after arranging the values from smallest to largest. If the dataset contains an even number of observations, the median is the average of the two middle values.
For the values 3, 5, 7, 9, and 11, the median is 7.
The mode is the value that occurs most often. For the dataset 2, 3, 3, 4, and 5, the mode is 3.
A weighted mean gives some observations more influence than others. Its formula is:
[
\bar{x}w=\frac{\sum{i=1}^{n}w_ix_i}{\sum_{i=1}^{n}w_i}
]
Here, (w_i) represents the weight assigned to observation (x_i). Weighted means are useful when calculating averages from grades, survey data, or other measurements with different levels of importance.
Variance and Standard Deviation Symbols
Variance and standard deviation measure how widely data values are spread around the mean. A dataset with values close to its mean generally has a smaller standard deviation than a dataset with values spread far apart.
| Symbol | Meaning |
| (\sigma^2) | Population variance |
| (s^2) | Sample variance |
| (\sigma) | Population standard deviation |
| (s) | Sample standard deviation |
| (SD) | Abbreviation for standard deviation |
| (SS) | Sum of squares |
| (R) | Range |
| (Q_1) | First quartile |
| (Q_2) | Second quartile, or median |
| (Q_3) | Third quartile |
| (IQR) | Interquartile range |
Variance Formulas
Population variance measures the average squared deviation from the population mean:
[
\sigma^2=\frac{\sum_{i=1}^{N}(x_i-\mu)^2}{N}
]
Sample variance is commonly calculated using (n-1) in the denominator:
[
s^2=\frac{\sum_{i=1}^{n}(x_i-\bar{x})^2}{n-1}
]
The sample formula with (n-1) is the usual unbiased estimator of population variance when observations are independently sampled under the standard assumptions.
Standard Deviation, Range, and Interquartile Range

Standard deviation is the square root of variance:
[
\sigma=\sqrt{\sigma^2}
]
[
s=\sqrt{s^2}
]
The range measures the difference between the largest and smallest observations:
[
R=x_{\max}-x_{\min}
]
The interquartile range measures the spread of the middle 50% of observations:
[
IQR=Q_3-Q_1
]
For example, if (Q_1=10) and (Q_3=18), then (IQR=8).
Variance is expressed in squared units, while standard deviation uses the same units as the original data. The interquartile range is often useful when a dataset contains outliers.
Probability Symbols and Their Meanings
Probability measures the likelihood of an event. Its value ranges from 0 to 1, where 0 means an impossible event and 1 means a certain event.
| Symbol | Meaning |
| (P(A)) | Probability of event (A) |
| (A^c) | Complement of event (A) |
| (P(A^c)) | Probability that (A) does not occur |
| (A\cup B) | Union of events (A) and (B |
| (A\cap B) | Intersection of events (A) and (B |
| (P(A\cup B)) | Probability that (A), (B), or both occur |
| (P(A\cap B)) | Probability that both events occur |
| (P(A\mid B)) | Probability of (A) given (B) |
| (E(X)) | Expected value of random variable (X) |
| (\operatorname{Var}(X)) | Variance of random variable (X) |
| (P(X=x)) | Probability that a discrete random variable equals (x) |
| (F(x)) | Cumulative distribution function |
Addition Rule and Complement Rule
The general addition rule for two events is:
[
P(A\cup B)=P(A)+P(B)-P(A\cap B)
]
You subtract the probability of the intersection because it would otherwise be counted twice.
If two events cannot occur together, they are mutually exclusive, so (P(A\cap B)=0). In that case, the addition rule simplifies to:
[
P(A\cup B)=P(A)+P(B)
]
The complement rule is:
[
P(A^c)=1-P(A)
]
If the probability of rain is 0.3, the probability of no rain is (1-0.3=0.7), assuming rain and no rain cover all possible outcomes.
Conditional Probability and Expected Value
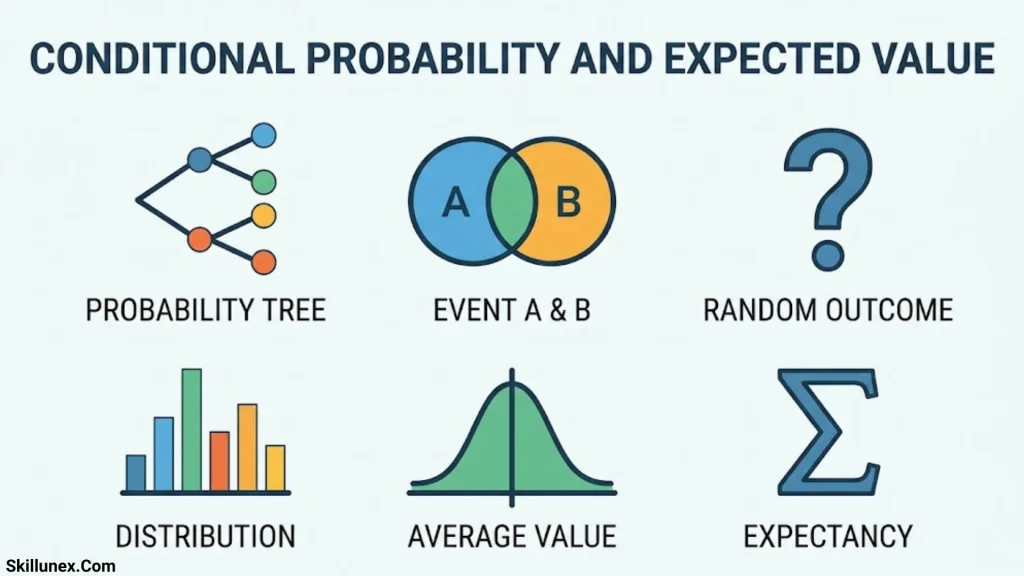
Conditional probability measures the chance of one event occurring when another event is known to have occurred:
[
P(A\mid B)=\frac{P(A\cap B)}{P(B)}
]
This formula requires (P(B)>0).
The expected value, written (E(X)), is the probability-weighted average of a random variable’s possible outcomes. For a discrete random variable:
[
E(X)=\sum_x xP(X=x)
]
For example, if a random variable equals 1 with probability 0.5 and 3 with probability 0.5, its expected value is:
[
E(X)=1(0.5)+3(0.5)=2
]
The expected value does not have to be an outcome that the random variable can actually take.
Hypothesis Testing Symbols
Hypothesis testing uses sample data to evaluate claims about a population. These symbols appear in tests involving means, proportions, correlations, and other statistical parameters.
| Symbol | Meaning |
| (H_0) | Null hypothesis |
| (H_a) or (H_1) | Alternative hypothesis |
| (\alpha) | Significance level |
| (\beta) | Type II error probability in hypothesis testing |
| (1-\beta) | Statistical power |
| (p\text{-value}) | Probability of a result at least as extreme as the observed result, assuming the null hypothesis and the test’s assumptions |
| (z) | Z-test statistic or standardized value |
| (t) | T-test statistic |
| (\chi^2) | Chi-square test statistic |
| (F) | F-test statistic |
| (df) | Degrees of freedom |
| (SE) | Standard error |
| (CI) | Confidence interval |
Null and Alternative Hypotheses
The null hypothesis, written (H_0), usually represents a claim of no effect, no difference, or a specified population parameter.
The alternative hypothesis, written (H_a) or (H_1), represents the competing claim.
For example, a researcher comparing two population means might test:
[
H_0:\mu_1=\mu_2
]
[
H_a:\mu_1\neq\mu_2
]
This is a two-sided test because the alternative allows either mean to be larger.
Other tests may use (<) or (>) in the alternative hypothesis when the research question specifies a direction.
Significance Level, P Value, and Statistical Power
The significance level (\alpha) is chosen before evaluating the test result. A common choice is 0.05.
If the p-value is less than or equal to (\alpha), researchers typically reject the null hypothesis under the selected testing procedure. Otherwise, they fail to reject it. Failing to reject (H_0) does not prove that it is true.
A Type I error occurs when a true null hypothesis is rejected. Its long-run probability is controlled by the significance level under the test’s assumptions.
A Type II error occurs when a false null hypothesis is not rejected. Its probability is denoted by (\beta), while statistical power is (1-\beta).
The p-value is not the probability that the null hypothesis is true. It describes how unusual the observed result, or a more extreme result, would be if the null hypothesis and the test assumptions were correct.
O in Statistics Symbol
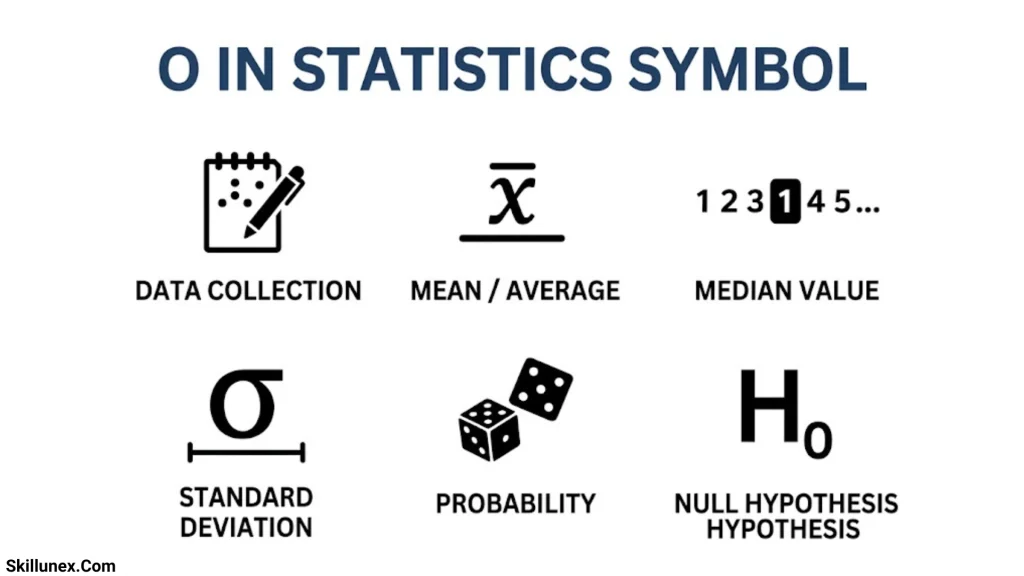
The letter O does not have one universal meaning in statistics. Its interpretation depends on whether it appears as a capital letter, a lowercase letter, a subscript, or part of a particular formula.
Here are some possible uses:
- Observed frequency (O): In some statistics textbooks, O represents an observed frequency, especially in chi-square tests. It describes the number of observations recorded in a category.
- Big O notation (O): In mathematical and computational contexts, Big O notation describes how a function grows as its input increases. It is more common in algorithm analysis than in introductory statistical calculations.
- The number zero (0): The numeral zero is sometimes mistaken for the capital letter O. They are different characters and have different uses in formulas.
For example, in a chi-square goodness-of-fit test, O may represent an observed frequency and E the expected frequency. The test statistic is calculated as:
2=(O-E)2E
Here, O is the observed count, E is the expected count, and 2 is the chi-square test statistic.
If you see O in a particular statistical equation, check the accompanying definitions before deciding what it means.
Correlation and Regression Symbols
Correlation describes the direction and strength of a linear relationship between two variables. Regression estimates a relationship that can be used to explain or predict an outcome.
| Symbol | Meaning |
| (r) | Sample correlation coefficient |
| (\rho) | Population correlation coefficient |
| (X) | Predictor or independent variable |
| (Y) | Response or dependent variable |
| (\hat{y}) | Predicted value of (y) |
| (b_0) | Estimated regression intercept |
| (b_1) | Estimated regression slope |
| (\beta_0) | Population regression intercept |
| (\beta_1) | Population regression slope |
| (e_i) | Residual for observation (i) |
| (\varepsilon) | Error term in a statistical model |
| (R^2) | Coefficient of determination |
Correlation Coefficients
The sample correlation coefficient (r) measures the strength and direction of a linear relationship. Its value ranges from (-1) to (+1).
- (r=+1): Perfect positive linear correlation.
- (r=-1): Perfect negative linear correlation.
- (r=0): No linear correlation in the sample.
A correlation near zero does not rule out a nonlinear relationship. Also, correlation alone does not establish that one variable causes changes in another.
The symbol (\rho) represents the corresponding population correlation coefficient.
Linear Regression Formulas
A simple linear regression model is commonly written as:
[
Y=\beta_0+\beta_1X+\varepsilon
]
Here, (\beta_0) is the population intercept, (\beta_1) is the population slope, and (\varepsilon) represents the model’s error term.
The fitted sample regression equation is:
[
\hat{y}=b_0+b_1x
]
The symbol (\hat{y}) represents the predicted outcome. The residual is the observed value minus the predicted value:
[
e_i=y_i-\hat{y}_i
]
The coefficient of determination, (R^2), describes the proportion of variation in the observed response accounted for by the fitted model under the usual definition. In a simple regression with an intercept, it is closely related to the squared sample correlation.
Greek Letters Used in Statistics
Greek letters often represent population parameters, error probabilities, distribution parameters, or model coefficients. Their meanings depend on the statistical context.
| Symbol | Name | Common Meaning |
| (\mu) | Mu | Population mean |
| (\sigma) | Sigma | Population standard deviation |
| (\sigma^2) | Sigma Squared | Population variance |
| (\rho) | Rho | Population correlation coefficient |
| (\alpha) | Alpha | Significance level or model parameter |
| (\beta) | Beta | Regression coefficient or Type II error probability |
| (\lambda) | Lambda | Rate parameter in distributions such as the Poisson |
| (\theta) | Theta | General unknown parameter |
| (\pi) | Pi | Mathematical constant or a probability parameter in some models |
| (\varepsilon) | Epsilon | Error term or small quantity |
| (\Delta) | Delta | Change or difference |
| (\Gamma) | Gamma | Gamma function or a parameter in certain distributions |
One important distinction is that Greek letters often represent population parameters, while Latin letters or related notation represent sample statistics. For example, (\mu) is the population mean and (\bar{x}) is the sample mean. This is a common convention, although notation varies across fields.
Statistical Distribution Symbols
Probability distributions describe the possible values of random variables and the probabilities associated with those values.
| Symbol | Meaning |
| (N(\mu,\sigma^2)) | Normal distribution with mean (\mu) and variance (\sigma^2) |
| (Z) | Standard normal random variable in common notation |
| (t_{df}) | Student’s t-distribution with specified degrees of freedom |
| (\chi^2_{df}) | Chi-square distribution with specified degrees of freedom |
| (F_{df_1,df_2}) | F-distribution with numerator and denominator degrees of freedom |
| (\operatorname{Bin}(n,p)) | Binomial distribution with (n) trials and success probability (p) |
| (\operatorname{Pois}(\lambda)) | Poisson distribution with rate parameter (\lambda) |
| (U(a,b)) | Uniform distribution over an interval from (a) to (b), under a common notation |
| (f(x)) | Probability density function or probability mass function, depending on context |
| (F(x)) | Cumulative distribution function |
Probability Density and Cumulative Distribution Functions
For a continuous random variable, (f(x)) commonly represents its probability density function. Probabilities are calculated over intervals rather than at a single point:
[
P(a\leq X\leq b)=\int_a^b f(x),dx
]
For a discrete random variable, (f(x)) may instead represent a probability mass function.
The cumulative distribution function is:
[
F(x)=P(X\leq x)
]
It gives the probability that a random variable takes a value less than or equal to (x).
Distribution notation is not universal. Check the definition of each parameter in your textbook or statistical software, especially when a normal distribution is written using standard deviation in one source and variance in another.
Mathematical Symbols Commonly Used in Statistics
Statistical formulas also rely on standard mathematical symbols. Understanding them helps you read equations without confusing an operation with a statistical measure.
| Symbol | Name | Meaning |
| (=) | Equal To | Two expressions have the same value |
| (\neq) | Not Equal To | Two expressions have different values |
| (<) | Less Than | One value is smaller |
| (>) | Greater Than | One value is larger |
| (\leq) | Less Than or Equal To | A value is smaller or equal |
| (\geq) | Greater Than or Equal To | A value is larger or equal |
| (\pm) | Plus or Minus | Indicates two possible signs |
| (\sqrt{x}) | Square Root | A value that squares to (x), when real |
| (\sum) | Summation | Adds specified values |
| (\prod) | Product | Multiplies specified values |
| (\in) | Element Of | Indicates membership in a set |
| (\notin) | Not an Element Of | Indicates nonmembership in a set |
| (\cup) | Union | Includes elements in either set |
| (\cap) | Intersection | Includes elements shared by sets |
| (\infty) | Infinity | Represents an unbounded quantity |
| (\log) | Logarithm | Logarithmic function |
| (\ln) | Natural Logarithm | Logarithm with base (e) |
| (\mid) | Given That | Often used in conditional probability |
For example, (P(A\mid B)) uses the vertical bar to mean that the probability of (A) is being calculated given that (B) has occurred.
Statistics Symbols Cheat Sheet for Exams
If you’re reviewing for a test, focus first on the symbols that appear most often in introductory statistics questions.
| Symbol | Quick Reminder |
| (n) | Sample size |
| (N) | Population size |
| (\bar{x}) | Sample mean |
| (\mu) | Population mean |
| (s) | Sample standard deviation |
| (\sigma) | Population standard deviation |
| (s^2) | Sample variance |
| (\sigma^2) | Population variance |
| (\hat{p}) | Sample proportion |
| (p) | Population proportion in many contexts; may also mean a p-value when labeled |
| (r) | Sample correlation |
| (\rho) | Population correlation |
| (SE) | Standard error |
| (CI) | Confidence interval |
| (df) | Degrees of freedom |
| (H_0) | Null hypothesis |
| (H_a) | Alternative hypothesis |
| (\alpha) | Significance level |
| (\beta) | Type II error probability or regression coefficient |
| (\sum) | Add the specified values |
| (P(A)) | Probability of event (A) |
| (E(X)) | Expected value |
| (R^2) | Coefficient of determination |
| (z) | Z-score or z-test statistic |
| (t) | T-statistic |
| (\chi^2) | Chi-square statistic |
| (F) | F-statistic |
How to Remember Common Statistics Symbols
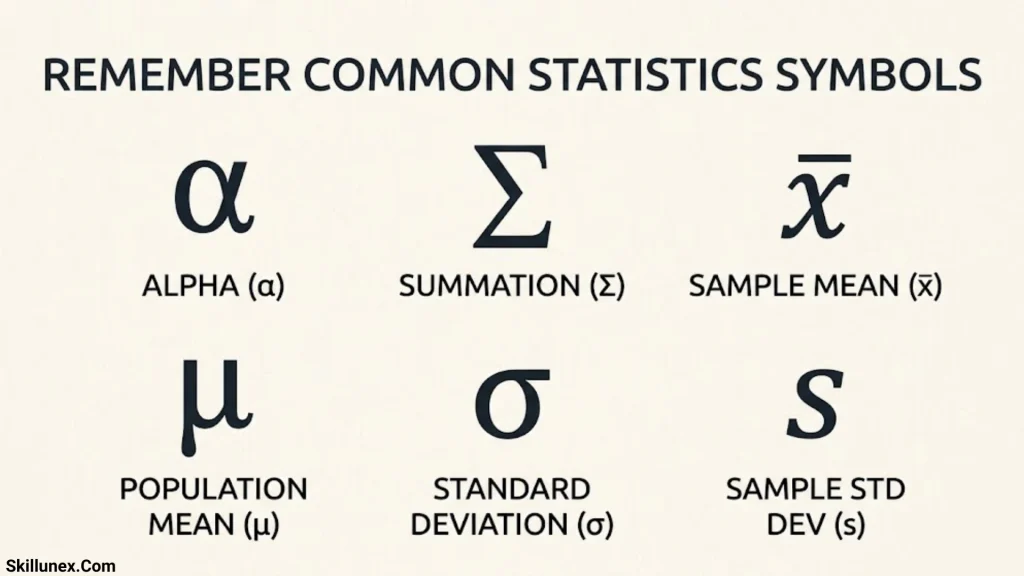
Use these simple distinctions to reduce confusion:
- Sample versus population: (n) and (\bar{x}) commonly describe a sample, while (N) and (\mu) commonly describe a population.
- Variance versus standard deviation: Variance uses squared units, while standard deviation uses the original measurement units.
- Parameter versus statistic: A parameter describes a population, while a statistic is calculated from sample data.
- Probability versus p-value: (P(A)) is general probability notation, while a p-value is a specific result from a statistical test.
- Correlation versus regression: (r) measures sample linear association, while regression estimates a relationship between predictor and response variables.
When studying, write the symbol, its meaning, and one example together. This is usually more effective than memorizing a list of symbols without understanding how they’re used.
Frequently Asked Questions
What Are the Most Common Symbols in Statistics?
The most common statistics symbols include (n) for sample size, (N) for population size, (\bar{x}) for sample mean, (\mu) for population mean, (s) for sample standard deviation, (\sigma) for population standard deviation, and (\sum) for summation. Probability and hypothesis testing also use symbols such as (P(A)), (H_0), (H_a), and (\alpha).
What Is the Difference Between (\mu) and (\bar{x})?
The symbol (\mu) represents the population mean, calculated using all values in the population. The symbol (\bar{x}) represents the sample mean, calculated using observations from a sample. Researchers often use the sample mean to estimate the population mean.
What Do (n) and (N) Mean in Statistics?
The lowercase (n) usually represents the number of observations in a sample. The uppercase (N) commonly represents the total number of members or observations in a population. For example, if a researcher surveys 100 people from a population of 2,000, then (n=100) and (N=2000).
What Is the Difference Between Variance and Standard Deviation?
Variance measures the average squared spread of observations around the mean, using a denominator appropriate to the population or estimator. Standard deviation is the square root of variance. Because standard deviation uses the original measurement units, it’s often easier to interpret.
What Does the Symbol (\sum) Mean?
The symbol (\sum), called sigma notation or summation notation, means to add a specified set of values. For example, (\sum_{i=1}^{3}x_i) means (x_1+x_2+x_3).
What Does the P-Value Mean in Statistics?
A p-value measures how likely a result at least as extreme as the observed result would be under the null hypothesis and the test’s assumptions. A small p-value can provide evidence against the null hypothesis, but it does not measure the probability that the null hypothesis is true.
What Is the Difference Between (r) and (\rho)?
The symbol (r) usually represents the sample correlation coefficient, calculated from observed data. The symbol (\rho) usually represents the population correlation coefficient. The sample value (r) can be used to estimate the population value (\rho).
Conclusion
A statistics symbols cheat sheet gives you a practical reference for understanding formulas, analyzing data, and interpreting statistical results. Start with the basic symbols for sample size, population size, mean, variance, standard deviation, and probability. Then build your knowledge of hypothesis testing, correlation, regression, and probability distributions.
Remember that statistical notation can vary between textbooks and disciplines. Check the context of a formula whenever a symbol has more than one meaning. With regular practice, you’ll recognize these symbols faster and use them more confidently in statistics problems.

Caleb Thornton
I’m Caleb Thornton, a researcher and content writer who loves exploring fascinating subjects and sharing what I learn with readers. My interests include natural places, lakes, symbols, culture, history, and the stories that make ordinary topics more meaningful.
When I write an article, I try to go beyond a basic answer. I look for useful facts, relevant context, and details that can help readers understand the subject more completely.
My purpose is simple: I want every article I contribute to provide genuine value, satisfy the reader’s curiosity, and make discovering new information enjoyable.
## Books by Caleb Thornton
* Symbols & Meanings: Exploring the Signs We See Every Day
* Lakes of the World: Nature, Beauty & Exploration