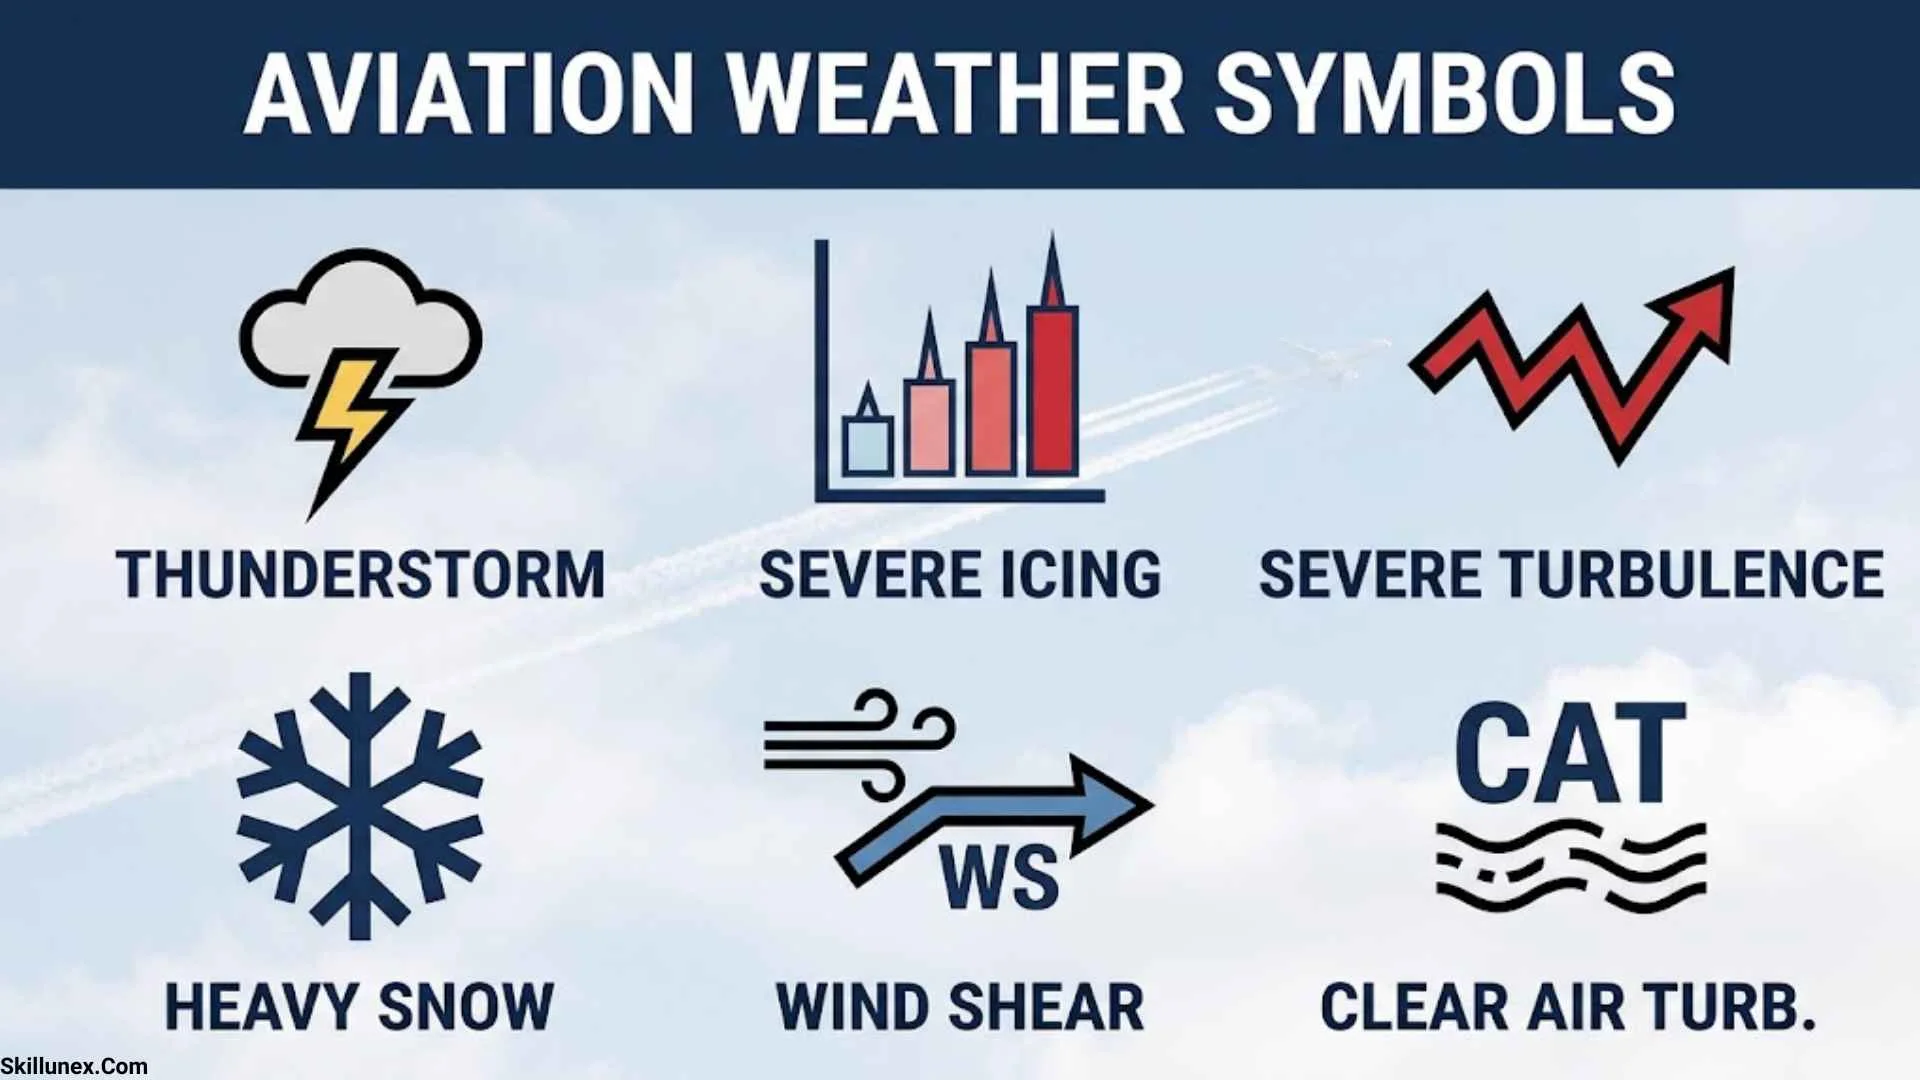
Aviation weather symbols help you understand weather conditions that can affect aircraft operations. Pilots, aviation students, flight dispatchers, and weather enthusiasts use these symbols to interpret wind direction, cloud cover, visibility, precipitation, turbulence, icing, and thunderstorms. Learning their meanings makes it easier to read aviation weather charts and understand important weather information before a flight.
When I study aviation weather symbols, I look at what each symbol represents and how you can recognize it on different weather products. Some symbols appear as lines, triangles, circles, and shaded areas, while others appear as abbreviations in METAR reports and TAF forecasts. Understanding these differences helps you interpret weather information more accurately.
In this guide, you will learn the meanings of common aviation weather symbols, how to read wind barbs, what cloud-cover codes represent, and how to recognize weather hazards on aviation charts. I will also explain important METAR and TAF abbreviations, flight categories, weather fronts, and significant weather markings in simple language.
What Are Aviation Weather Symbols?
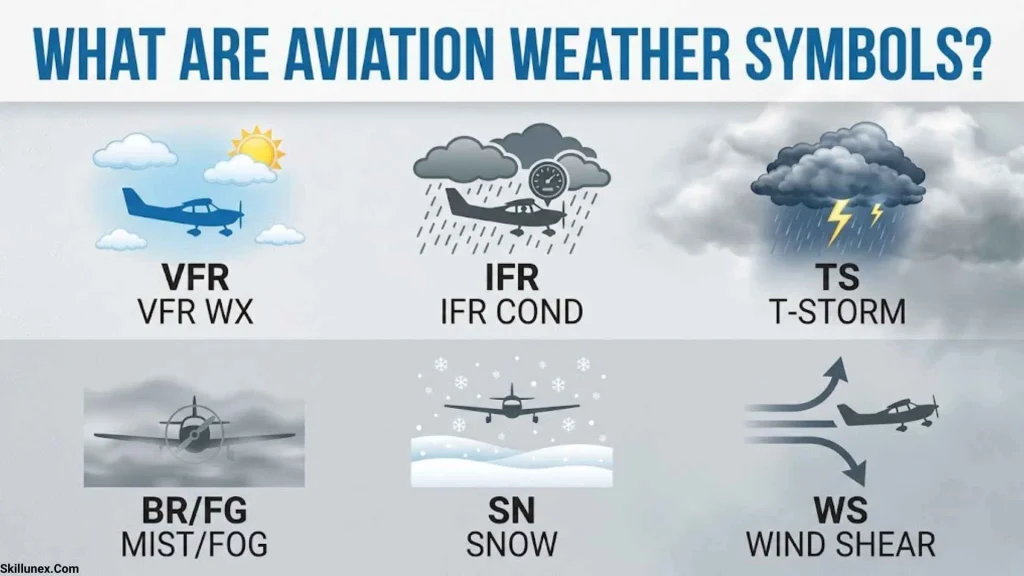
Aviation weather symbols are graphical signs, markings, and standardized abbreviations used to communicate atmospheric conditions relevant to aviation. They help you understand weather information quickly without reading lengthy descriptions of every condition.
For example, a wind barb shows wind direction and speed, while a line with triangles commonly represents a cold front on a surface weather chart. In a METAR report, abbreviations such as RA, FG, and TS represent rain, fog, and thunderstorms.
These symbols appear on several aviation weather products, including surface weather maps, significant weather charts, METAR reports, TAF forecasts, radar displays, and winds aloft charts. Their exact appearance depends on the product and its reporting conventions, so you should always check the chart legend.
Why Aviation Weather Symbols Are Important
Aviation weather symbols help you recognize atmospheric conditions that may affect flight planning, aircraft performance, and airport operations.
- Flight planning: Wind and weather information helps you evaluate routes and estimate flight time.
- Visibility assessment: Fog, haze, precipitation, and cloud ceilings influence visibility and operating conditions.
- Hazard recognition: Turbulence, icing, thunderstorms, and wind shear can create serious aviation hazards.
- Airport operations: Strong winds, poor visibility, and precipitation may affect takeoffs and landings.
- Weather interpretation: Symbols help you compare current observations with forecasts and hazard advisories.
Understanding these markings improves your ability to interpret aviation weather information, but symbols alone cannot determine whether a flight is safe.
Where Aviation Weather Symbols Are Used
| Weather product | Main purpose | Information provided |
| METAR | Reports observed airport weather | Wind, visibility, clouds, temperature, and present weather |
| TAF | Forecasts airport weather | Expected wind, visibility, cloud conditions, and weather changes |
| Surface weather chart | Displays surface weather systems | Fronts, pressure centers, and troughs |
| SIGWX chart | Shows significant forecast weather | Turbulence, cumulonimbus clouds, jet streams, and other hazards |
| Winds aloft chart | Shows upper-level wind conditions | Wind direction, speed, and temperatures at specified altitudes |
| Weather radar | Displays precipitation-related echoes | Rain and thunderstorm structures |
| Satellite imagery | Shows atmospheric and cloud patterns | Cloud systems and large-scale weather features |
| PIREP | Reports weather encountered by pilots | Turbulence, icing, cloud tops, and other in-flight conditions |
Each product provides different information. A METAR describes observed conditions at an airport, while a TAF forecasts expected conditions over a specified period.
Common Aviation Weather Symbols and Their Meanings
Aviation weather charts use different markings to communicate weather conditions. Learning the most common symbols gives you a useful foundation for interpreting more detailed charts.
| Symbol or marking | Meaning | Explanation |
| Blue line with triangles | Cold front | A boundary where colder air advances |
| Red line with semicircles | Warm front | A boundary where warmer air advances |
| Alternating triangles and semicircles on opposite sides | Stationary front | A front with little movement |
| Alternating triangles and semicircles on the same side | Occluded front | A front formed when a cold front catches up with a warm front |
| H | High-pressure center | Often associated with relatively stable atmospheric conditions |
| L | Low-pressure center | May be associated with clouds, precipitation, and unsettled weather |
| Wind barb | Wind direction and speed | Uses a shaft, feathers, and pennants |
| Filled or partly filled circle | Cloud amount on a station plot | Shows the fraction of the sky covered by clouds |
| CB | Cumulonimbus | A cloud type associated with thunderstorms |
| TS | Thunderstorm | A standard weather abbreviation |
| MOD | Moderate | A severity descriptor used in applicable aviation products |
| SEV | Severe | A severity descriptor used in applicable aviation products |
| IFR | Instrument flight rules category | Indicates specified ceiling or visibility conditions in relevant weather products |
| MVFR | Marginal visual flight rules category | Indicates marginal ceiling or visibility conditions |
These descriptions are general. Always use the legend for the specific chart you are reading because symbols and colors may differ between products.
Aviation Weather Front Symbols
Weather fronts are boundaries between air masses with different characteristics. They can bring changes in temperature, wind, clouds, and precipitation. Recognizing these symbols helps you understand how weather systems may affect an airport or flight route.
Cold Front Symbol
A cold front is commonly shown as a blue line with blue triangles. The triangles generally point in the direction the front is moving.
A cold front forms when colder air advances into warmer air. The advancing air can lift the warmer air, sometimes producing showers, thunderstorms, gusty winds, and rapid changes in weather.
When you see a cold front on a weather chart, check the surrounding observations and forecasts. The front itself does not tell you the exact conditions at every location.
Warm Front Symbol
A warm front is commonly represented by a red line with red semicircles. The semicircles generally point toward the direction of movement.
A warm front forms when warmer air advances over colder air. This process can produce extensive cloud layers and widespread precipitation. Low ceilings and reduced visibility may occur, depending on the atmospheric conditions.
If you are evaluating a warm front near an airport, review the forecast visibility, cloud ceiling, and precipitation rather than assuming that every location will experience the same weather.
Stationary Front Symbol
A stationary front is commonly represented by alternating blue triangles and red semicircles on opposite sides of a line.
It indicates that the boundary between two air masses has little movement. Clouds and precipitation may persist near the front, and repeated showers or thunderstorms can occur under suitable conditions.
When a stationary front affects your planned route, pay attention to the forecast period because its influence may continue for an extended time.
Occluded Front Symbol
An occluded front is usually represented by a purple line with alternating triangles and semicircles on the same side.
It forms when a cold front catches up with a warm front, lifting the warm air away from the surface. Occluded fronts may be associated with widespread cloud cover, precipitation, and changing winds.
The actual weather depends on the surrounding air masses and atmospheric conditions, so you should check the accompanying forecast information.
Aviation Wind Symbols and Wind Barbs
Wind symbols show the direction and speed of airflow. Wind conditions affect takeoff and landing performance, crosswind exposure, flight duration, fuel consumption, and turbulence assessment.
A wind barb usually consists of a shaft with feathers or pennants. The shaft shows the direction from which the wind is blowing, while the feathers and pennants indicate wind speed.
How to Read a Wind Barb
The commonly used aviation wind-barb convention includes these values:
| Wind-barb marking | Wind speed |
| Half-barb | 5 knots |
| Full barb | 10 knots |
| Pennant | 50 knots |
| Two full barbs and one half-barb | 25 knots |
For example, two full barbs and one half-barb indicate a wind speed of 25 knots.
If the shaft points toward the north, the wind is coming from the north. Wind speeds are commonly expressed in knots on aviation weather charts, although you should check the units provided.
Headwind, Tailwind, and Crosswind
Wind direction becomes especially important when you compare it with the direction of an aircraft or runway.
| Wind type | Meaning | Effect |
| Headwind | Wind blowing toward the aircraft’s nose during forward travel | Usually reduces takeoff and landing ground distance compared with a tailwind, all else being equal |
| Tailwind | Wind blowing in the same general direction as aircraft travel | Can increase takeoff and landing ground distance |
| Crosswind | Wind blowing across the direction of travel or runway | Can make directional control more demanding |
| Gusty wind | Wind speed changes over short periods | Can affect aircraft handling and approach stability |
| Wind shear | A rapid change in wind speed or direction over a short distance | Can create significant hazards, especially near takeoff and landing |
A wind barb does not determine whether the wind is safe for a particular aircraft. You must consider runway direction, gusts, aircraft limitations, and applicable operating procedures.
Wind Symbols at Different Altitudes
Surface winds and upper-level winds can differ considerably. Winds aloft charts help pilots understand wind direction and speed at specified altitudes.
Strong winds aloft can affect flight time and fuel planning. Wind gradients can also contribute to turbulence, particularly near jet streams and other atmospheric boundaries.
When you examine an upper-level wind chart, check the altitude, wind speed, direction, and forecast validity period.
Aviation Cloud Cover Symbols and Abbreviations
Cloud-cover symbols show how much of the sky is covered by clouds. On meteorological station plots, cloud amounts may be represented by empty, partly filled, or fully filled circles.
Cloud information is important because cloud ceilings can influence flight conditions. METAR and TAF reports use standardized abbreviations to describe cloud coverage and cloud-base heights.
Cloud-Cover Codes in METAR and TAF
| Code | Meaning | Cloud amount |
| SKC | Sky clear under applicable reporting conventions | No cloud cover reported |
| FEW | Few clouds | 1–2 oktas |
| SCT | Scattered clouds | 3–4 oktas |
| BKN | Broken clouds | 5–7 oktas |
| OVC | Overcast | 8 oktas |
| VV | Vertical visibility | Used when the sky is obscured and vertical visibility is reported |
An okta represents one-eighth of the sky. Reporting conventions vary by country and system. For example, some reports use for no clouds detected below a specified altitude rather than using.
How to Read Cloud Heights
In standard METAR and TAF reports, cloud heights are generally expressed in hundreds of feet above ground level.
| Code | Meaning |
| FEW015 | Few clouds at 1,500 feet AGL |
| SCT025 | Scattered clouds at 2,500 feet AGL |
| BKN035 | Broken clouds at 3,500 feet AGL |
| OVC008 | Overcast clouds at 800 feet AGL |
A broken or overcast cloud layer can establish the ceiling used in aviation weather assessments. The lowest qualifying broken or overcast layer is especially important when determining the reported ceiling.
Cloud amount and ceiling are related but different. Cloud amount describes coverage, while ceiling refers to the lowest broken or overcast layer or qualifying vertical visibility under the applicable reporting convention.
Important Cloud Types in Aviation
| Cloud type | Abbreviation | Aviation relevance |
| Cumulonimbus | CB | Associated with thunderstorms, turbulence, lightning, hail, and possible icing |
| Towering cumulus | TCU | May indicate strong vertical development and possible thunderstorms |
| Stratus | No universal METAR cloud-type code | Low cloud layers can reduce ceiling and visibility |
| Altocumulus | No universal METAR cloud-type code | May provide clues about atmospheric conditions |
| Lenticular clouds | No universal METAR cloud-type code | May indicate mountain-wave activity |
Cloud types can provide useful clues, but you should combine observations with official forecasts and hazard information.
Aviation Weather Symbols for Rain, Snow, Fog, and Thunderstorms
Weather abbreviations help describe precipitation and visibility-reducing conditions. In coded aviation reports, short letter combinations often replace graphical symbols.
Understanding these codes helps you recognize weather conditions that may affect aircraft operations.
Common Precipitation and Weather Codes
| Code | Meaning |
| RA | Rain |
| DZ | Drizzle |
| SN | Snow |
| SG | Snow grains |
| PL | Ice pellets |
| GR | Hail |
| GS | Small hail or snow pellets under applicable reporting conventions |
| TS | Thunderstorm |
| SH | Showers |
| FZ | Freezing phenomenon |
| FG | Fog |
| BR | Mist |
| HZ | Haze |
| SQ | Squall |
| FC | Funnel cloud, tornado, or waterspout under applicable reporting conventions |
These codes can be combined with descriptors to provide more detail. For example, -RA indicates light rain, while RA indicates heavy rain in standard METAR weather coding.
The prefix can be combined with a weather code to indicate a freezing phenomenon. You should consult the applicable reporting guide when interpreting combinations.
Rain and Snow Symbols
Rain can reduce visibility and contribute to wet-runway conditions. Heavy precipitation may complicate airport operations and make it harder to see nearby terrain or other aircraft.
Snow can reduce visibility, accumulate on runways, and require additional ground operations. Aircraft may also need deicing procedures when contamination is present.
When you see rain or snow in a weather report, check precipitation intensity, visibility, temperature, wind, and current airport conditions.
Fog, Mist, and Haze Codes
Fog and mist reduce visibility by suspending tiny water droplets in the air. Haze can also reduce visibility, but its composition and atmospheric characteristics differ from those of fog.
The standard METAR codes include:
- FG for fog.
- BR for mist.
- HZ for haze.
These conditions can affect approaches, landings, and airport operations. Always check the reported visibility and relevant forecasts rather than relying on the code alone.
Thunderstorm Symbols and Cumulonimbus Clouds
Thunderstorms are among the most important aviation weather hazards. The abbreviation TS indicates a thunderstorm, while CB identifies cumulonimbus clouds when used in the appropriate context.
Thunderstorms may produce severe turbulence, lightning, hail, heavy precipitation, strong updrafts and downdrafts, wind shear, and microbursts.
A thunderstorm symbol does not describe every hazard associated with the storm. Review official forecasts, radar information, warnings, and relevant significant weather charts. Radar also has limitations and cannot show every aviation hazard directly.
Aviation Weather Symbols for Turbulence
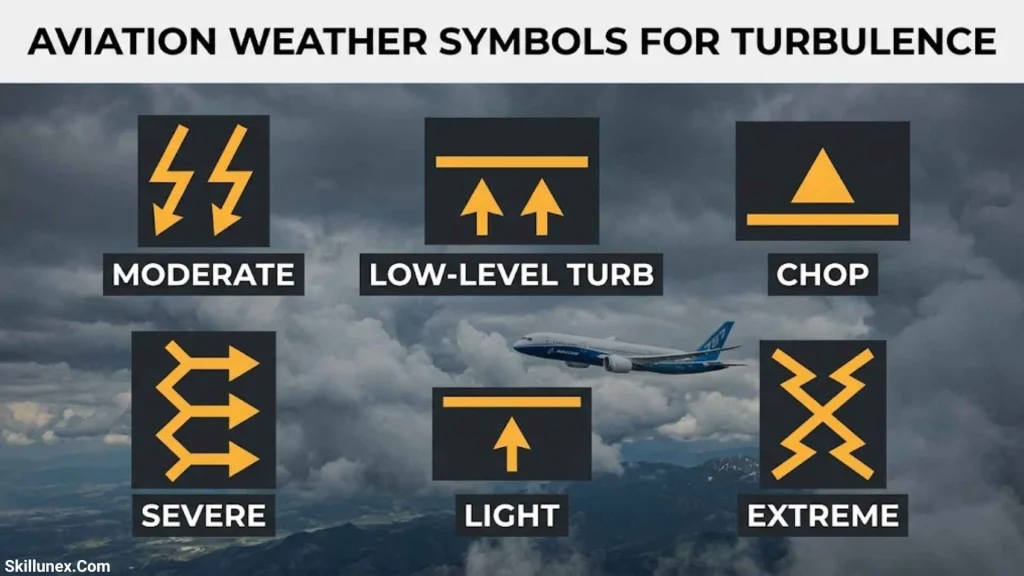
Turbulence is irregular atmospheric motion that causes an aircraft to experience changes in movement. It can occur in clouds, near thunderstorms, around mountains, or in relatively clear air near strong wind gradients.
Aviation weather charts may use shaded areas, boundaries, symbols, or labels to identify forecast turbulence and its altitude range.
Types and Categories of Turbulence
| Category or type | Meaning | Potential effect |
| Light turbulence | Relatively small changes in aircraft movement | Minor discomfort or brief altitude changes |
| Moderate turbulence | More noticeable changes in aircraft movement | Movement around the cabin may become difficult |
| Severe turbulence | Large, abrupt changes in aircraft movement | May create significant control and occupant-safety concerns |
| Extreme turbulence | Exceptionally violent atmospheric disturbances | May seriously affect aircraft control |
| Clear-air turbulence (CAT) | Turbulence in cloud-free air | May occur without visible cloud warnings |
| Mountain-wave turbulence | Turbulence associated with airflow over mountainous terrain | May include strong vertical currents and rotor turbulence |
These descriptions are general. Official reporting definitions depend on the applicable aviation meteorological guidance and aircraft response.
How Turbulence Appears on Aviation Charts
Significant weather charts may outline turbulence areas and identify severity and altitude information. Abbreviations such as MOD and SEV can represent moderate and severe turbulence.
Some products show the base and top of a turbulence layer using flight levels. You should interpret these values according to the chart’s conventions.
Clear-air turbulence can occur without visible clouds, making forecast information, upper-level winds, and pilot reports especially useful. Review current official advisories when assessing turbulence risks.
Aviation Icing Symbols and Their Meanings
Aircraft icing occurs when ice accumulates on aircraft surfaces or components. It can increase drag, reduce lift, alter control characteristics, and affect engines or instruments.
Icing forecasts may use shaded regions, boundaries, labels, or other graphical markings to indicate where icing is expected. The exact presentation depends on the weather product.
Common Icing Severity Categories
| Category | General meaning |
| Trace | Ice accumulation is small and may be barely perceptible |
| Light | Ice accumulation is generally limited but may become significant with prolonged exposure |
| Moderate | Ice accumulation can become hazardous and may require prompt operational action |
| Severe | Ice may accumulate rapidly and exceed the capabilities of normal ice-protection systems |
These descriptions are general and do not replace official icing definitions or aircraft procedures.
Freezing Rain and Supercooled Water
Freezing rain and supercooled cloud droplets can create dangerous icing conditions. Supercooled droplets remain liquid below freezing and may freeze when they contact an aircraft.
Freezing rain can produce rapid ice accumulation. The risk also depends on temperature, moisture, droplet size, and exposure time.
A temperature below freezing does not automatically mean icing will occur. Suitable moisture and atmospheric conditions must also be present.
How to Interpret an Icing Forecast
When reading an icing chart, check the forecast area, severity, altitude range, issue time, and valid period. Compare the icing information with turbulence forecasts and thunderstorm information where relevant.
Icing forecasts help you evaluate potential hazards, but conditions can vary within a forecast area. Use current official products and follow applicable aircraft limitations and operating procedures.
Aviation Weather Symbols for Visibility and Flight Categories
Visibility and cloud ceiling describe conditions that affect how pilots can operate. Many US aviation weather products use four flight categories: VFR, MVFR, IFR, and LIFR.
These categories summarize ceiling and visibility conditions. They do not describe every aviation hazard or automatically determine the legal requirements for every flight.
VFR, MVFR, IFR, and LIFR Meanings
| Category | Common US ceiling threshold | Common US visibility threshold |
| VFR | Generally above 3,000 feet AGL or no qualifying ceiling | Greater than 5 statute miles |
| MVFR | 1,000–3,000 feet AGL | 3–5 statute miles |
| IFR | 500 to less than 1,000 feet AGL | 1 to less than 3 statute miles |
| LIFR | Below 500 feet AGL | Less than 1 statute mile |
The ceiling and visibility thresholds are joined by or. If either meets a more restrictive category, the overall category may reflect that lower category.
These are common US graphical flight-category thresholds. You should check the specific product and jurisdiction because reporting conventions can differ.
Common Colors Used for Flight Categories
Some US graphical aviation weather products use these colors:
- Green: VFR conditions.
- Blue: MVFR conditions.
- Red: IFR conditions.
- Magenta: LIFR conditions.
These colors are not universal. Some products leave VFR areas unoutlined, while others use different visual conventions.
When you see a colored region, check the legend to determine whether it represents a flight category, precipitation, icing, turbulence, or another weather feature.
Aviation Weather Symbols on METAR Reports
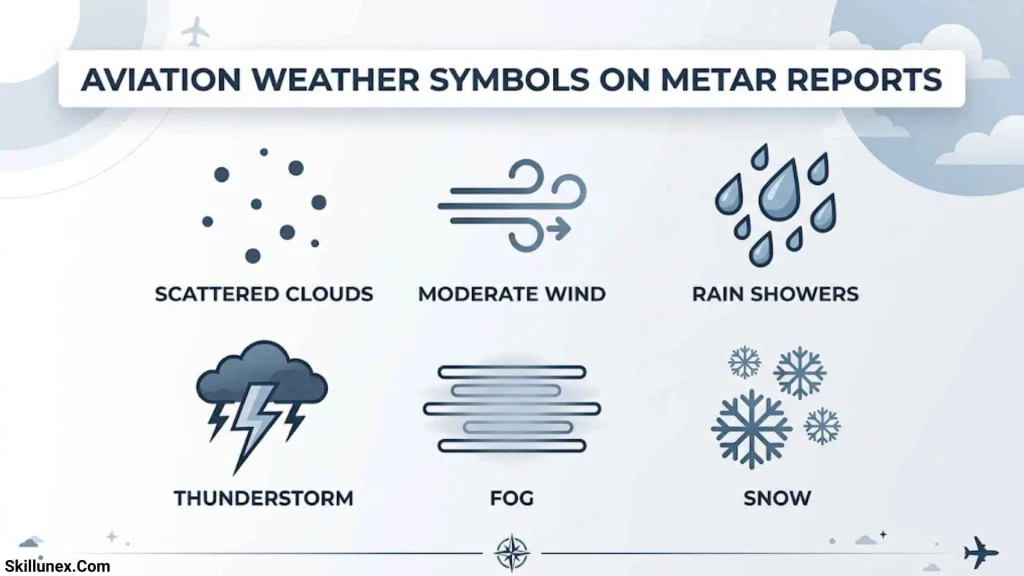
A METAR is a coded report of observed weather at an airport. It commonly includes wind, visibility, present weather, cloud layers, temperature, dew point, and atmospheric pressure.
Learning to read METAR reports helps you interpret current airport weather without relying exclusively on graphical maps.
Example of a METAR Report
This example is for educational purposes and does not represent a verified current observation.
| Report element | Meaning |
| METAR | Routine meteorological airport report |
| OPLA | ICAO location identifier for Lahore airport |
| 121200Z | Observation on the 12th at 1200 UTC |
| 27010KT | Wind from 270 degrees at 10 knots |
| 5000 | Visibility of 5,000 meters |
| -RA | Light rain |
| SCT020 | Scattered clouds at 2,000 feet AGL |
| BKN035 | Broken clouds at 3,500 feet AGL |
| 28/22 | Temperature of 28°C and dew point of 22°C |
| Q1008 | QNH pressure of 1008 hectopascals |
The exact format may vary by country and reporting system. Some reports include additional information about runway visual range, recent weather, wind shear, and remarks.
How to Read a METAR Correctly
Start with the airport identifier and observation time. Next, interpret the wind, visibility, weather conditions, and cloud layers. Finally, review temperature, dew point, pressure, and any additional remarks.
When comparing multiple reports, confirm that their observation times are relevant. An older METAR may no longer represent current conditions.
Aviation Weather Symbols on TAF Forecasts
A TAF, or Terminal Aerodrome Forecast, describes expected weather conditions at an airport over a specified period. Unlike a METAR, which reports observed conditions, a TAF provides a forecast.
TAFs use many of the same wind, visibility, weather, and cloud codes as METARs. They also include change groups that describe when conditions may change.
Common TAF Change Indicators
| Code | General meaning |
| FM | From a specified time, a new set of prevailing conditions is forecast |
| TEMPO | Temporary fluctuations are expected during the stated period |
| PROB30 | A 30% probability of specified conditions, where this group is permitted |
| BECMG | Conditions are expected to change during a specified period, where used |
The permitted groups and their exact usage depend on the applicable TAF format and national reporting rules.
For example, TEMPO indicates that temporary conditions may occur during a specified time window. It does not mean those conditions will prevail continuously throughout the entire period.
When reading a TAF, check the validity period, prevailing conditions, change groups, and any amendments. Compare the forecast with current METAR observations and other relevant weather products.
Aviation Weather Symbols on Significant Weather Charts
Significant Weather (SIGWX) charts display forecast atmospheric conditions that may substantially affect flight operations. Each chart is designed for a particular altitude range and forecast period.
Depending on the product, these charts may show turbulence, cumulonimbus clouds, jet streams, tropopause heights, tropical cyclones, and other significant weather features.
Jet Streams and Upper-Level Winds
A jet stream is a relatively narrow band of strong winds in the upper atmosphere. Aviation charts may show jet-stream axes with wind-speed labels and flight-level information.
Jet streams can affect flight duration and fuel planning. Strong wind gradients near them may also be associated with turbulence.
A jet-stream marking does not automatically indicate severe turbulence. You should examine the turbulence forecast, altitude range, and other atmospheric information.
Thunderstorms and Significant Cloud Areas
SIGWX charts may outline areas of cumulonimbus clouds and show their vertical extent or other forecast characteristics. Some products include additional details about associated hazards.
These markings help you identify regions where significant weather may occur, but they do not guarantee the exact location or intensity of every storm at a particular moment.
Flight Levels and Altitude Information
Aviation charts may express altitude using flight levels, such as FL100 or FL300. Flight levels are based on a standard pressure reference rather than a direct height above the terrain.
Always interpret flight levels according to the chart instructions and applicable operating procedures. Do not automatically treat a flight level as height above ground level.
Aviation Weather Symbols for Pressure Systems and Troughs
Pressure systems and troughs help explain larger weather patterns. They commonly appear on surface analysis charts and other meteorological products.
High-Pressure Systems
The letter H commonly marks a high-pressure center. High pressure is often associated with descending air and relatively stable atmospheric conditions, but it does not guarantee clear skies or favorable flying weather.
Fog, haze, and low clouds may still occur under high pressure. Check current observations and forecasts rather than relying on the pressure symbol alone.
Low-Pressure Systems
The letter L commonly marks a low-pressure center. Low-pressure systems often involve rising air and may produce clouds, precipitation, and unsettled weather.
Their effects depend on the system’s structure, movement, moisture, and atmospheric instability. Interpret a low-pressure marking alongside fronts, winds, precipitation, and other chart information.
Trough Symbols
A trough is an elongated region of relatively low pressure or cyclonic curvature. Its graphical representation varies among weather charts.
Troughs may be associated with showers, thunderstorms, cloud development, or wind changes, but not every trough produces hazardous weather.
When you identify a trough, check the surrounding weather information and forecast timing. Do not assume that one line style or color represents a trough on every aviation chart.
How to Read an Aviation Weather Chart Step by Step
Learning individual symbols is useful, but you also need a consistent method for interpreting an entire chart.
Identify the Chart Type
Determine whether you are viewing a surface analysis chart, METAR plot, TAF, winds aloft forecast, SIGWX chart, radar image, or satellite image. Each product communicates different information.
Check the Issue Time and Valid Period
Find when the product was issued and the period it covers. Many aviation weather products use UTC, so convert the time if necessary and confirm the date.
Read the Legend
Identify the meanings of colors, line patterns, symbols, and labels. This prevents you from confusing a flight-category boundary with a turbulence or icing area.
Review Wind and Visibility
Check wind direction, speed, gusts where reported, visibility, and cloud ceiling. These conditions can influence runway operations and the weather encountered along a route.
Identify Significant Weather Hazards
Look for thunderstorms, icing, turbulence, wind shear, mountain obscuration, and other hazards relevant to the aircraft and route.
Check the Altitude Range
Confirm whether a hazard applies near the surface, at a particular altitude, or across a vertical layer. A hazard forecast at one flight level does not necessarily represent conditions at every altitude.
Compare Multiple Weather Products
Compare current observations with forecasts, radar, satellite imagery, pilot reports, and official hazard advisories as appropriate. Each product provides a different part of the If picture.
Verify the Latest Information
Weather can change quickly. Before a flight, use current official aviation weather products, required briefings, and applicable operational procedures.
Common Mistakes When Reading Aviation Weather Symbols
Even when you know the basic symbols, it is possible to misinterpret weather information. Understanding common mistakes helps you read charts more accurately.
Treating Every Symbol as Universal
A symbol may have different meanings across chart types or software. Identify the product and consult its legend before interpreting unfamiliar markings.
Confusing Observations With Forecasts
A METAR reports observed airport weather, while a TAF forecasts expected airport conditions. They serve different purposes and should not be treated as interchangeable.
Ignoring the Valid Time
A chart may be accurate for its stated period but no longer represent current conditions. Always check its issue time and validity.
Assuming High Pressure Guarantees Good Weather
High pressure often brings relatively stable conditions, but fog, haze, and low clouds can still develop. Use actual observations and forecasts.
Assuming a Thunderstorm Symbol Shows Every Hazard
Thunderstorms can produce hazards beyond their visible precipitation areas. A single symbol does not describe every detail about turbulence, wind shear, hail, or storm movement.
Confusing Cloud Amount With Ceiling
Cloud amount describes how much of the sky is covered. Ceiling refers to the lowest qualifying broken or overcast layer or vertical visibility under the applicable reporting convention. These concepts are related but not identical.
Using Flight Categories as the Only Measure of Safety
VFR, MVFR, IFR, and LIFR describe certain ceiling and visibility conditions. They do not fully describe every aviation hazard or establish the legal operating requirements for every flight.
For practice, select a current aviation weather chart and identify its type, valid time, legend, wind information, cloud conditions, and significant hazards. Then compare your interpretation with the relevant official observations and forecasts.
Frequently Asked Questions About Aviation Weather Symbols
What Are the Most Common Aviation Weather Symbols?
Common aviation weather symbols include weather fronts, wind barbs, cloud-cover markings, pressure centers, and significant-weather hazard markings. METAR and TAF reports also use abbreviations such as RA for rain, FG for fog, TS for thunderstorms, and CB for cumulonimbus clouds.
What Does a Blue Triangle Mean on a Weather Map?
On a conventional surface weather chart, a blue line with triangles generally represents a cold front. The triangles point toward the direction of movement. Always check the chart legend because symbols can vary between products.
What Do Red Semicircles Mean on an Aviation Weather Chart?
A red line with semicircles commonly represents a warm front. The semicircles generally point toward the direction in which the front is moving.
How Do You Read a Wind Barb?
Read the shaft to determine the direction from which the wind is blowing. Count the feathers and pennants to calculate speed. In the common convention, a half-barb represents 5 knots, a full barb represents 10 knots, and a pennant represents 50 knots.
What Do VFR, MVFR, IFR, and LIFR Mean?
These abbreviations describe flight categories based on ceiling and visibility thresholds in applicable aviation weather products. VFR means visual flight rules category, MVFR means marginal visual flight rules category, IFR means instrument flight rules category, and LIFR means low instrument flight rules category.
What Does CB Mean in Aviation Weather?
CB stands for cumulonimbus, a cloud type associated with thunderstorms. These clouds can produce lightning, hail, severe turbulence, wind shear, heavy precipitation, and icing.
What Is the Difference Between METAR and TAF?
A METAR reports observed weather at an airport, while a TAF forecasts expected airport weather over a specified period. Both use coded abbreviations, but their purposes and time references differ.
Where Can I Find Official Aviation Weather Charts?
You can find aviation weather information through the FAA, the Aviation Weather Center, and official national meteorological services. Use the appropriate authority for your operating region and check the chart legend and valid period.
Conclusion
Aviation weather symbols make complex meteorological information easier to understand. Learning the meanings of weather fronts, wind barbs, cloud-cover codes, precipitation abbreviations, flight categories, and turbulence and icing indicators helps you interpret aviation weather charts more confidently.
The key is to read symbols in context. Identify the chart, check its valid time, consult the legend, and compare the information with current observations and forecasts. This approach helps you avoid common mistakes and understand how weather conditions may affect aviation operations.
With regular practice, you can become more comfortable reading METAR reports, TAF forecasts, surface weather charts, and significant weather products. Always use current authoritative aviation weather information and applicable operating procedures for flight-related decisions.

Isla Kensington
I’m Isla Kensington, a writer with a passion for research, culture, nature, and the fascinating meanings behind everyday things. I enjoy taking topics that may seem simple at first and discovering the history, facts, and ideas that make them more interesting.
I write with readers in mind. My aim is to provide clear explanations, useful information, and interesting details without making a topic unnecessarily complicated.
I believe learning should feel like discovering something rather than simply reading facts. That philosophy guides the content I create and the topics I choose to explore.
## Books by Isla Kensington
* Symbols Around the World: A Guide to Meaning & Culture
* Nature’s Beautiful Places: Lakes, Landscapes & Natural Treasures