Have you ever opened a Six Sigma process map and wondered what all those rectangles, diamonds, arrows, circles, and other shapes are trying to tell you? If you are learning Six Sigma or working on process improvement, understanding these symbols can make a complicated workflow much easier to follow. I know that when you first see a detailed process map, it can feel overwhelming, but once you understand the visual language, the information becomes much clearer.
In this guide, you’ll learn the most commonly used Six Sigma process map symbols, what each symbol means, how the symbols are used, and how they help you understand a process. I’ll also cover flowchart symbols, SIPOC, swimlane maps, decision points, inputs and outputs, rework, process mapping in DMAIC, common mistakes, and practical examples so you can confidently read or create a Six Sigma process map.
Quick Answer: What Are Six Sigma Process Map Symbols?
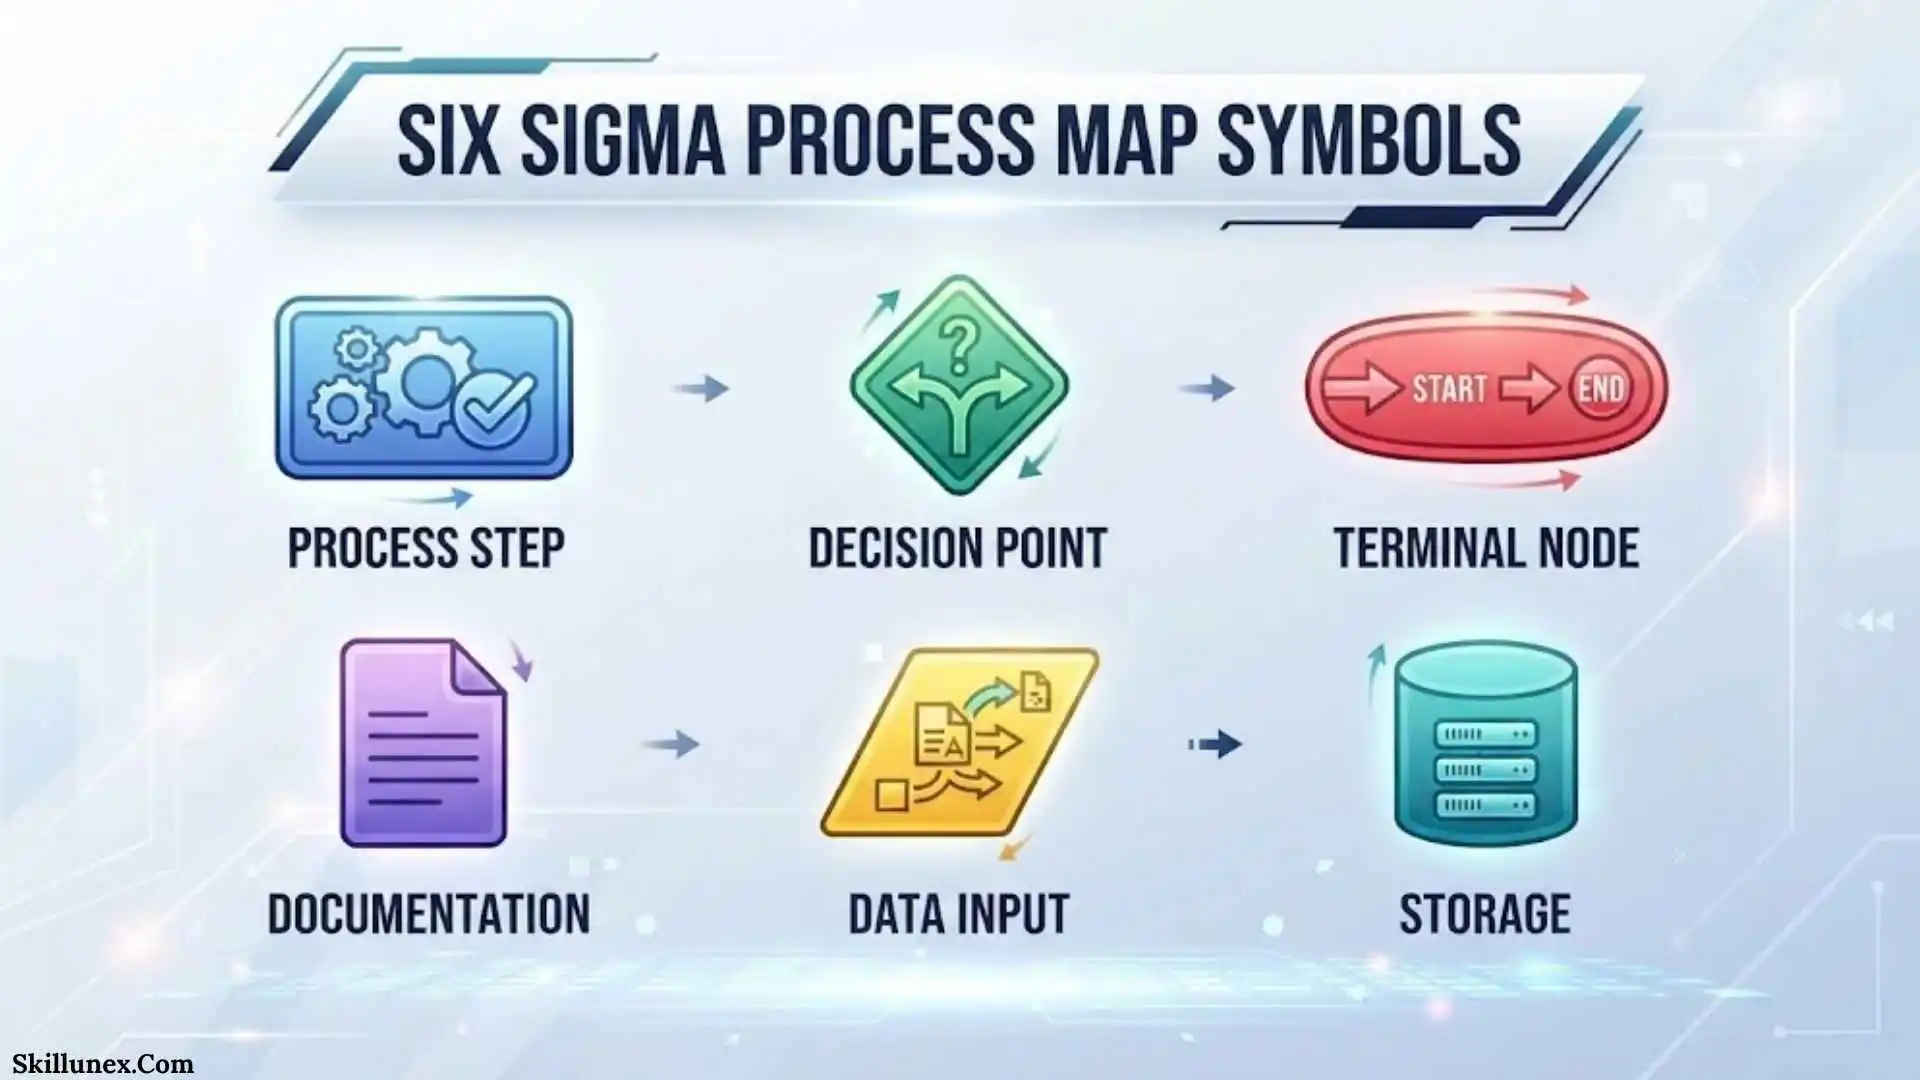
Six Sigma process map symbols are visual shapes and markings used to represent different parts of a process, including activities, decisions, starts and stops, inputs, outputs, documents, data, and the direction of workflow.
The most common symbols include:
| Symbol | Common Meaning |
| Oval | Start or end |
| Rectangle | Process or activity |
| Diamond | Decision |
| Arrow | Direction of flow |
| Parallelogram | Input or output |
| Document shape | Document or report |
| Cylinder | Database or stored data |
| Circle | On-page connector |
| Pentagon | Off-page connector |
| Double-lined rectangle | Predefined process or subprocess |
The exact symbols used can vary between organizations and mapping methods. Traditional flowchart notation is common, while specialized approaches such as value stream mapping may use different symbols.
What Is A Six Sigma Process Map?
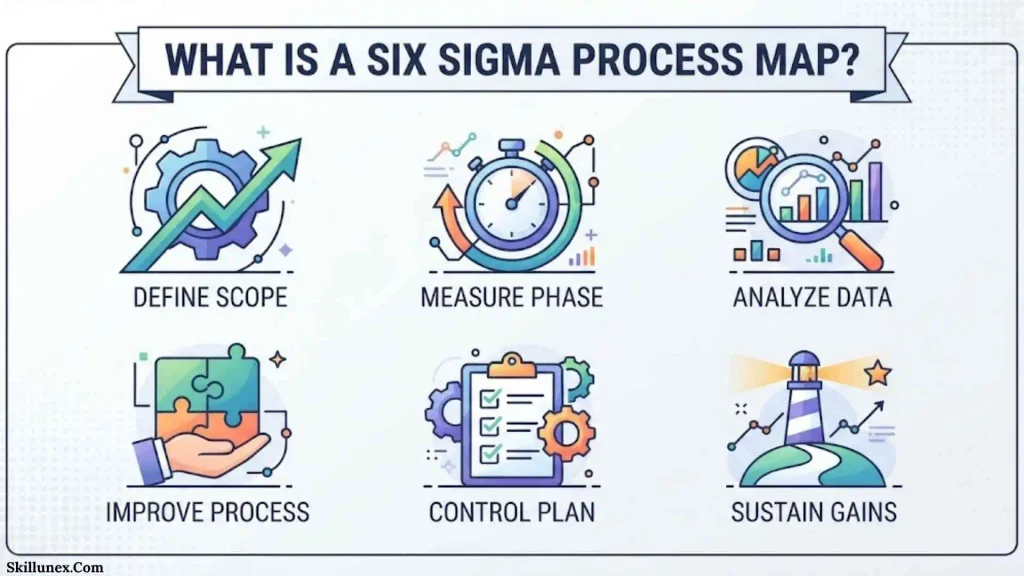
A Six Sigma process map is a visual representation of the steps, decisions, inputs, outputs, and interactions involved in a process.
For example, a simple order process might look like:
Receive Order → Verify Order → Process Payment → Prepare Product → Ship Product
A more detailed map can show what happens when payment is rejected, where information is stored, which department performs each step, and where rework occurs.
Why Process Mapping Is Important
If you are trying to improve a process, you first need to understand how that process currently works.
A process map can help you identify:
- Unnecessary steps
- Bottlenecks
- Delays
- Rework
- Duplicate work
- Handoffs
- Decision points
- Sources of defects
- Process variation
- Responsibilities
The map gives you a visual picture of the process instead of forcing you to understand everything through paragraphs of written procedures.
Current-State And Future-State Maps
A current-state map describes how the process operates now.
A future-state map describes how the process is intended to operate after improvements are made.
If I were documenting a process for improvement, I would first make sure the current-state map reflects what actually happens rather than what a procedure manual says should happen.
Common Six Sigma Process Map Symbols
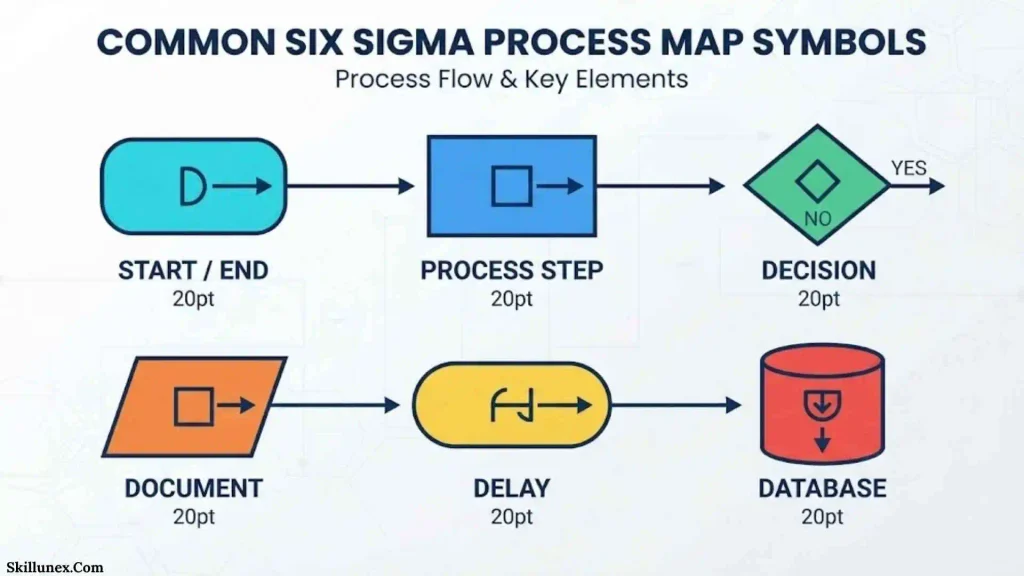
The following symbols are commonly encountered when creating or reading process maps.
Start And End Symbol
An oval, also called a terminator, is commonly used to show the beginning or end of a process.
Examples include:
Start
Receive Customer Request
End
The symbol establishes the boundaries of the workflow.
Process Step Symbol
A rectangle generally represents an activity or process step.
Examples include:
Enter Customer Information
Inspect Product
Approve Application
Pack Order
A useful process box should describe an action rather than simply naming an object.
For example, Customer Order is vague, while Review Customer Order describes an activity.
Decision Symbol
A diamond represents a decision.
A decision should generally be written as a question or condition.
For example:
Is the order complete?
The process can then branch into:
Yes → Continue
No → Return For Correction
Decision diamonds make branching logic visible.
Arrow Symbol
An arrow shows the direction of process flow.
For example:
Receive Order → Verify Order → Ship Order
The arrow tells you what happens next.
When a process has several branches, arrows also show where each decision path goes.
Input And Output Symbol
A parallelogram is traditionally used in flowcharts to represent input or output.
Examples include:
Enter Customer Data
Display Confirmation
Receive Information
However, not every Six Sigma process map uses a parallelogram. Some organizations use other conventions or simply identify inputs and outputs through labels and process-map structure.
Document Symbol
A document symbol typically looks like a rectangle with a curved or wavy bottom.
It represents a document, form, report, or other record.
Examples include:
- Invoice
- Inspection report
- Application form
- Shipping document
- Quality report
This symbol is useful when paperwork or electronic documents are important to the workflow.
Database Symbol
A cylinder commonly represents a database or stored information.
Examples include:
- Customer database
- Inventory database
- Employee records
- Order-management system
It helps you see where process information is stored or retrieved.
Connector Symbol
A small circle can be used as an on-page connector.
Connectors are helpful when a diagram is large and connecting lines would otherwise become confusing.
A connector allows you to indicate that the process continues at another point on the same page.
Off-Page Connector
A pentagon-shaped symbol is commonly used as an off-page connector in traditional flowchart notation.
It indicates that the process continues on another page.
This can be useful for large process maps that cannot fit comfortably on one page.
Predefined Process Symbol
A predefined-process symbol is commonly represented by a rectangle with additional vertical lines.
It indicates a subprocess that has been defined elsewhere.
For example:
Perform Credit Check
could represent a detailed procedure that is documented separately.
This keeps a high-level process map from becoming unnecessarily complicated.
Six Sigma Process Map Symbols Cheat Sheet
| Symbol | Meaning | Example |
| Oval | Start or end | Start process |
| Rectangle | Activity | Inspect product |
| Diamond | Decision | Is product acceptable? |
| Arrow | Flow | Move to next step |
| Parallelogram | Input/output | Enter data |
| Document | Document/report | Inspection report |
| Cylinder | Data storage | Customer database |
| Circle | On-page connector | Continue elsewhere |
| Pentagon | Off-page connector | Continue on another page |
| Predefined process | Subprocess | Perform credit check |
You can use this table as a quick reference when you are learning process mapping.
How Process Map Symbols Work Together
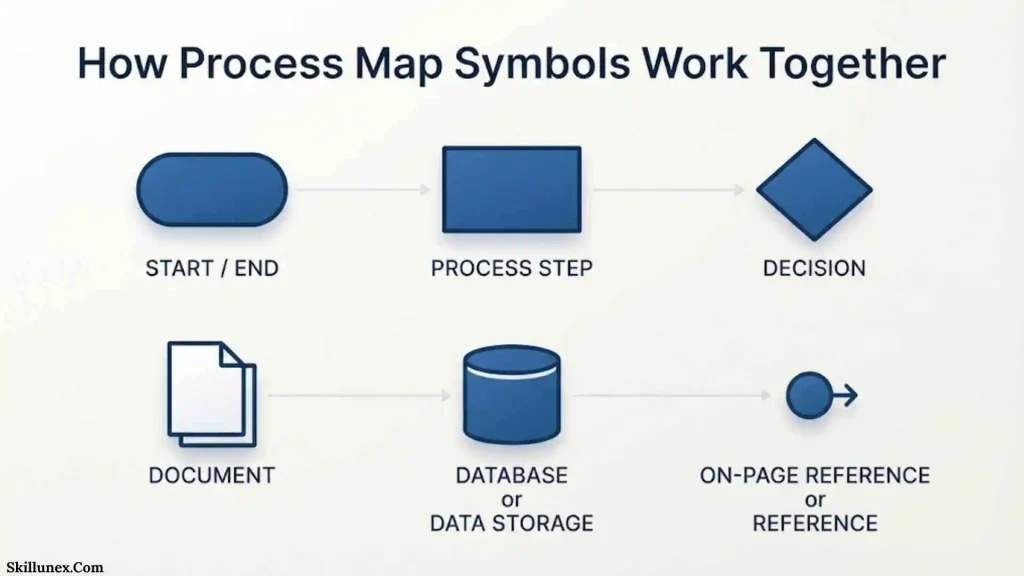
A process map becomes useful when the symbols form a logical sequence.
For example:
Start → Receive Order → Is Information Complete?
From the decision:
Yes → Process Order → Ship Order → End
No → Contact Customer → Receive Missing Information → Process Order
Notice how the symbols work together:
- The start symbol establishes where the process begins.
- Rectangles show activities.
- The diamond creates a decision.
- Arrows show movement.
- The end symbol identifies where the process finishes.
The meaning comes from the combination of symbols, not from any individual shape alone.
Decision Symbols And Process Branches
Decision points deserve special attention because they can create multiple process paths.
How To Write A Decision
A decision is usually clearer when written as a question.
Instead of:
Order Complete
use:
Is Order Complete?
This makes the possible answers easier to understand.
Common Decision Outcomes
A decision may have outcomes such as:
- Yes / No
- Pass / Fail
- Approved / Rejected
- Accept / Return
- Available / Unavailable
For example:
Is Product Within Specification?
Yes → Continue
No → Rework Product
This makes quality-related decisions easy to identify.
Why Decisions Matter In Six Sigma
When I analyze a process map, I pay attention to decision points because they can reveal:
- Rejections
- Exceptions
- Approvals
- Rework
- Delays
- Different customer experiences
A decision point is not automatically a problem. It simply shows where the process can take different paths.
Rework And Loop Symbols
Some processes move backward as well as forward.
For example:
Inspect Product → Pass Inspection?
If yes:
Ship Product
If no:
Repair Product → Inspect Product
The second path creates a rework loop.
What Rework Can Show
A process map can make repeated activities visible, including:
- Repeated inspections
- Data corrections
- Returned applications
- Failed approvals
- Product repairs
- Duplicate entries
This information can then be investigated using appropriate Six Sigma analysis.
Rework Is Not Always Waste
It is important not to assume that every loop is automatically unnecessary.
Some processes legitimately require:
- Safety checks
- Quality inspections
- Regulatory approvals
- Error correction
The map shows the loop; additional analysis is needed to determine whether the loop should be changed.
Inputs And Outputs In Six Sigma Process Maps
Inputs and outputs are fundamental to process analysis.
What Is An Input?
An input is something required for a process to operate.
Examples include:
- Customer information
- Raw materials
- Orders
- Data
- Equipment
- Instructions
- Documents
For example, a manufacturing process might require raw materials and production instructions.
What Is An Output?
An output is something produced by the process.
Examples include:
- Finished products
- Reports
- Services
- Approved applications
- Invoices
- Customer notifications
A good process map makes it easier to see how inputs are transformed into outputs.
Input-Process-Output Relationship
A simple model is:
Input → Process → Output
For example:
Customer Order → Order Processing → Confirmed Shipment
This basic relationship is central to understanding many business and manufacturing processes.
SIPOC And Six Sigma Process Mapping
SIPOC is a common high-level Six Sigma tool.
The acronym stands for:
- S = Suppliers
- I = Inputs
- P = Process
- O = Outputs
- C = Customers
Suppliers
Suppliers provide the inputs.
They may include:
- External vendors
- Customers
- Internal departments
- Service providers
Inputs
Inputs are the resources or information required by the process.
Examples include:
- Materials
- Data
- Orders
- Forms
- Equipment
Process
The process represents the major transformation steps.
A SIPOC normally keeps these steps at a high level rather than showing every detailed activity.
Outputs
Outputs are the results produced by the process.
Examples include:
- Products
- Services
- Reports
- Approvals
- Notifications
Customers
Customers receive or use the outputs.
A customer may be external or another department within the organization.
Swimlane Process Map Symbols
A swimlane process map adds responsibility to the process.
The map is divided into lanes for different:
- Departments
- Employees
- Roles
- Teams
- Systems
For example:
| Sales | Finance | Warehouse |
| Receive order | Verify payment | Pick product |
| Confirm order | Approve transaction | Ship product |
The process symbols are placed inside the lane of the person, department, or system responsible for that activity.
Why Swimlanes Are Useful
Swimlanes make handoffs easier to see.
You can identify when work moves from:
Sales → Finance → Warehouse → Customer Service
If you are investigating delays, unclear ownership, or communication problems, this additional information can be valuable.
Value Stream Mapping Symbols
Value stream mapping, or VSM, is another process-improvement mapping approach frequently associated with Lean and Lean Six Sigma.
VSM uses specialized symbols to show:
- Process steps
- Inventory
- Material flow
- Information flow
- Suppliers
- Customers
- Data
- Improvement opportunities
Process Boxes
Process boxes represent major process activities.
Inventory Triangles
A triangle is commonly used in VSM to represent inventory or work-in-process.
Information Flow
Different arrow styles can be used to show how information moves through a value stream.
Data Boxes
Data boxes can contain information such as:
- Cycle time
- Changeover time
- Number of operators
- Availability
- Defect information
Because VSM has its own conventions, you should use a VSM-specific legend when necessary.
Six Sigma Process Maps And DMAIC
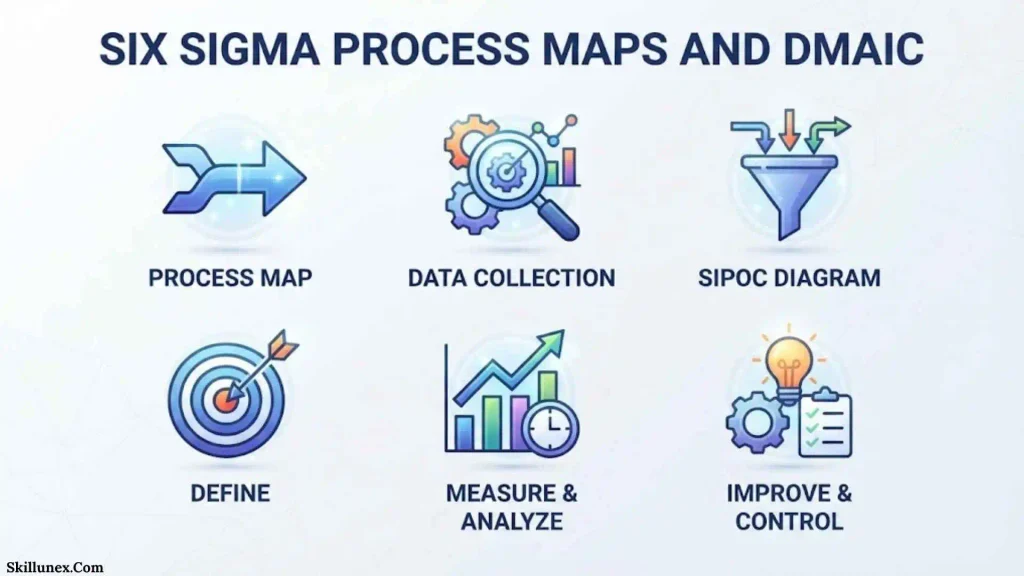
Process maps can support the different stages of the Six Sigma DMAIC methodology.
Define
During Define, a high-level map can help establish the process scope and identify the customers and major process boundaries.
Measure
During Measure, the process map can help identify where data is generated and where measurements can be collected.
Analyze
During Analyze, the map can help you examine:
- Bottlenecks
- Handoffs
- Rework
- Delays
- Decision points
- Potential causes of defects
Improve
During Improve, you can compare the existing process with proposed changes and create a future-state process map.
Control
During Control, the process map can document the improved process and help communicate the expected workflow.
How To Create A Six Sigma Process Map
If you are creating a process map from scratch, start with the actual process rather than the symbols.
Define The Process Boundaries
First decide where the process starts and ends.
For example:
Start: Customer places order
End: Customer receives order
Clear boundaries keep the map focused.
List The Major Steps
Write down the major activities in sequence.
For example:
- Receive order
- Verify information
- Check payment
- Prepare product
- Inspect product
- Ship order
Add Decisions
Identify points where the process can take different paths.
For example:
Is payment approved?
Is product acceptable?
Is customer information complete?
Add Inputs And Outputs
Identify what enters and leaves each important process stage.
This helps clarify what each activity needs and produces.
Add Responsibilities
If several departments or roles are involved, consider using swimlanes.
This makes ownership and handoffs visible.
Verify The Map
Finally, validate the map with the people who actually perform the work.
A documented procedure and the real process may not always be identical.
If I were validating a process map, I would ask employees to walk through the actual workflow, including exceptions and unusual cases, rather than relying only on written procedures.
Common Mistakes With Six Sigma Process Map Symbols
Even when you know the symbols, it is easy to create a confusing process map.
Using Symbols Inconsistently
If you use a rectangle for an activity in one section and a completely different shape for the same type of activity elsewhere, readers may become confused.
Choose a convention and apply it consistently.
Mixing Mapping Standards
Traditional flowcharts, SIPOC diagrams, swimlane maps, and value stream maps do not necessarily use identical notation.
If you combine methods, explain the symbols with a legend.
Writing Vague Process Steps
A process box labeled:
Order
does not tell the reader what happens.
A clearer label would be:
Verify Customer Order
Ignoring Rework
If an application is frequently returned for correction, the map should show that path when it is relevant to understanding the process.
Making The Map Too Detailed
A process map can become difficult to read when every tiny action is included.
Use different levels of mapping when appropriate:
- High-level process map
- Detailed process map
- Subprocess map
Mapping Only The Ideal Process
One of the most important mistakes is documenting only what is supposed to happen.
The current-state map should reflect the actual process, including meaningful exceptions and rework.
Assuming Every Symbol Has One Universal Meaning
Symbol conventions vary.
If your company, software, training program, or methodology provides a standard, follow that standard.
Tips For Making A Clear Six Sigma Process Map
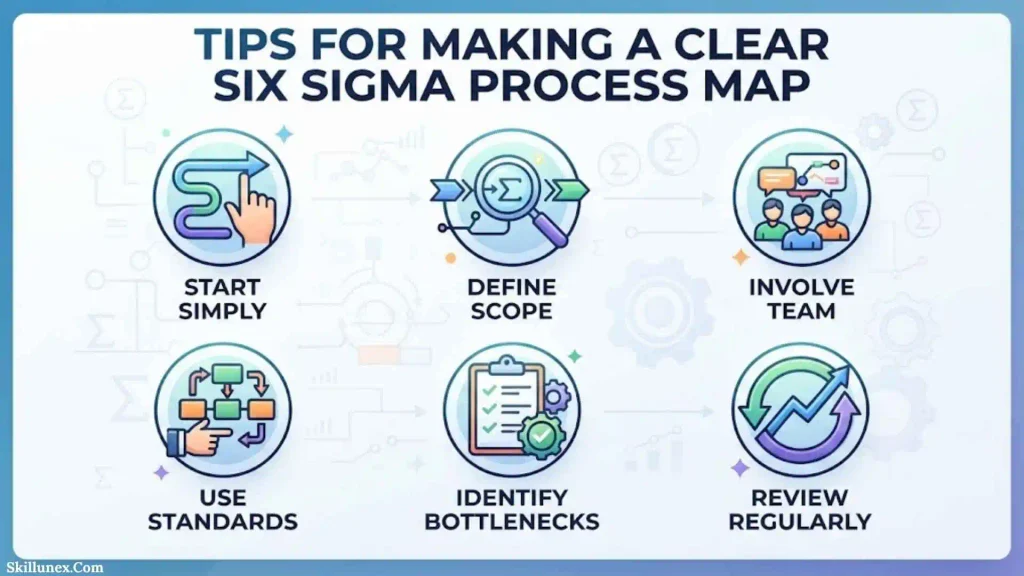
Keep Process Labels Action Oriented
Use verbs such as:
- Review
- Verify
- Approve
- Inspect
- Enter
- Calculate
- Package
- Ship
Action-oriented labels make the workflow easier to understand.
Keep The Flow Direction Consistent
Most maps are easier to read when the process moves consistently from left to right or top to bottom.
Avoid Unnecessary Line Crossings
Too many crossing lines can make a diagram difficult to follow.
Use connectors when appropriate.
Include A Legend
If your map uses specialized symbols, include a legend explaining them.
Validate With Process Participants
The people who perform the work can often identify exceptions or informal steps that are missing from official documentation.
Frequently Asked Questions About Six Sigma Process Map Symbols
What Is A Six Sigma Process Map?
A Six Sigma process map is a visual representation of a process that shows activities, decisions, inputs, outputs, relationships, and flow.
What Does A Rectangle Mean In Six Sigma Process Mapping?
A rectangle commonly represents a process activity or task, such as reviewing an order or inspecting a product.
What Does A Diamond Mean On A Process Map?
A diamond usually represents a decision point where the process can branch into different paths.
What Does An Oval Mean On A Process Map?
An oval commonly represents the start or end of a process.
What Does An Arrow Mean In Process Mapping?
An arrow shows the direction of flow from one process step, decision, or event to another.
What Does A Cylinder Represent?
A cylinder commonly represents a database or stored information.
What Does A Document Symbol Mean?
A document symbol represents a document, form, report, or similar record used or produced by the process.
What Is A Swimlane Process Map?
A swimlane process map divides a process into lanes representing departments, roles, people, or systems. It helps show who performs each activity and where handoffs occur.
What Is The Difference Between A SIPOC And A Process Map?
A SIPOC provides a high-level view of Suppliers, Inputs, Process, Outputs, and Customers. A process map generally provides more detail about the sequence and relationships between process activities.
Are Six Sigma Process Map Symbols Universal?
No. Different organizations and mapping methods can use different conventions. Traditional flowchart symbols are common, but specialized approaches may use their own notation.
What Is The Most Important Symbol In A Process Map?
There is no single symbol that is universally the most important. The appropriate symbols depend on what information the process map needs to communicate.
Why Are Decision Points Important?
Decision points show where the process can take different paths. They can help you identify approvals, rejections, exceptions, and rework.
Why Should Rework Be Shown On A Process Map?
Showing relevant rework makes repeated activities visible. This can help teams investigate additional processing, delays, corrections, and potential improvement opportunities.
Should A Six Sigma Process Map Show Every Small Task?
Not necessarily. The level of detail should match the purpose of the map. A high-level map can show major stages, while a detailed map can document individual activities.
How Do I Choose The Right Process Map Symbols?
Start with the mapping standard used by your organization or project. Then use symbols consistently and include a legend if the notation may not be obvious to readers.
Conclusion
Understanding Six Sigma process map symbols gives you a practical way to read and document workflows. Ovals can identify process boundaries, rectangles can represent activities, diamonds can show decisions, arrows can indicate flow, and other symbols can represent documents, databases, inputs, outputs, and connectors. When these symbols are combined carefully, they can turn a complicated workflow into a visual sequence that is easier to understand.
I hope this guide gives you a clearer way to approach process mapping. When you create your own map, start with the real process, define its boundaries, identify the major activities, add decisions and handoffs, and then choose symbols that communicate the information clearly. You’ll get more value from a simple, accurate process map than from a complicated diagram that is difficult for people to follow.

Isla Kensington
I’m Isla Kensington, a writer with a passion for research, culture, nature, and the fascinating meanings behind everyday things. I enjoy taking topics that may seem simple at first and discovering the history, facts, and ideas that make them more interesting.
I write with readers in mind. My aim is to provide clear explanations, useful information, and interesting details without making a topic unnecessarily complicated.
I believe learning should feel like discovering something rather than simply reading facts. That philosophy guides the content I create and the topics I choose to explore.
## Books by Isla Kensington
* Symbols Around the World: A Guide to Meaning & Culture
* Nature’s Beautiful Places: Lakes, Landscapes & Natural Treasures