A graduated symbols map is a type of thematic map that uses symbols of different sizes to show the quantity or magnitude of a geographic feature. Larger symbols usually represent higher values, while smaller symbols represent lower values. This makes it easier to compare places and understand patterns without reading large amounts of data.
Graduated symbols maps are commonly used to display statistics such as population, sales, production, traffic volume, rainfall, or the number of businesses in different locations. Because the symbols change according to numerical values, you can quickly identify areas with the highest and lowest amounts.
If you are learning cartography, studying geography, working with GIS, or simply trying to understand statistical maps, knowing how graduated symbols work can help you interpret geographic information more effectively.
What Is a Graduated Symbols Map?
A graduated symbols map is a thematic map in which symbols are sized according to the numerical value of a geographic variable. Each symbol is placed at a specific location, and its size communicates the amount associated with that location.
For example, imagine a map showing the population of several cities. A city with a population of 5 million might have a large circle, while a city with a population of 500,000 would have a much smaller circle.
The symbols can represent many different features, including circles, squares, proportional shapes, or other geometric forms. The most important characteristic is that symbol size changes to represent differences in data values.
How Graduated Symbols Work
The basic idea is simple: more data produces a larger symbol, and less data produces a smaller symbol.
For example:
- A small circle can represent a low population.
- A medium circle can represent a moderate population.
- A large circle can represent a high population.
A map legend explains what the different symbol sizes mean. Readers can compare the symbols on the map with the legend to estimate or understand the values represented.
Graduated Symbols vs. Proportional Symbols
Graduated symbols and proportional symbols are closely related, but they are not always used in exactly the same way.
A graduated symbols map generally places data values into classes or ranges and assigns a symbol size to each class. A proportional symbol map can scale the symbol more directly according to the actual numerical value.
For example, a graduated map might use three or five symbol sizes for different value ranges, while a proportional symbol map may calculate a symbol size for each individual value.
Both methods are useful for visualizing numerical geographic data, but graduated symbols can make a large dataset easier to read and compare.
What Do Graduated Symbols Represent on a Map?
Graduated symbols can represent almost any quantitative geographic information that is connected to a specific location. The choice depends on the purpose of the map and the available data.
Population Data
Population is one of the most common examples of graduated symbols mapping. A map can use different-sized circles to show the population of cities, counties, states, or countries.
The largest symbols identify locations with larger populations, while smaller symbols identify locations with fewer residents.
Economic and Business Data
Graduated symbols can also show economic information. For example, a map could display:
- Annual sales by city
- Number of businesses by region
- Factory production
- Agricultural output
- Tourism revenue
- Household income
- Retail customers
A larger symbol indicates a higher numerical value for the selected variable.
Transportation and Traffic
Transportation planners can use graduated symbols to visualize traffic-related information. Symbols can represent traffic volume at specific locations, passenger numbers at transportation hubs, or the number of vehicles using particular facilities.
This can help reveal areas where transportation activity is especially high.
Environmental and Physical Data
Graduated symbols can also be used for environmental information when the data is associated with specific locations.
Examples include rainfall measurements, water usage, waste production, or recorded environmental observations. The symbol size allows readers to compare quantities across different points on the map.
Types of Graduated Symbol Maps
Graduated symbols can be designed in several ways depending on the type of data, map scale, and purpose.
Circle Graduated Symbols
Circles are among the most commonly used symbols because they are easy to recognize and compare. A series of different-sized circles can represent increasing or decreasing numerical values.
For example, a population map might use circles ranging from very small to very large. The map legend shows which population ranges correspond to each size.
Square Graduated Symbols
Squares can also be used to represent quantitative data. They provide a different visual appearance from circles and can be useful when a map designer wants a more structured symbol.
The same principle applies: larger squares represent larger values and smaller squares represent smaller values.
Custom Graduated Symbols
Some maps use custom symbols instead of basic geometric shapes. A map about airports, for example, might use an aircraft-related symbol whose size changes according to passenger volume.
Custom symbols can make a map more visually engaging, but they should remain easy to compare and understand.
How to Read a Graduated Symbols Map
Reading a graduated symbols map becomes easier when you understand the legend and the relationship between symbol size and data.
Start With the Map Legend
The legend is the first place to look. It explains what the different symbol sizes represent.
A legend might show:
- Small circle = 100,000 people
- Medium circle = 500,000 people
- Large circle = 1 million people
- Very large circle = 5 million people
The exact values depend on the dataset and classification method.
Compare Symbol Sizes
After understanding the legend, compare the symbols across the map. Larger symbols indicate higher values when the map follows the standard graduated-symbol convention.
Try to compare symbols that are close in size rather than relying only on their visual area. This can help you make more consistent interpretations.
Identify Geographic Patterns
Once you understand the values, look for patterns. You might notice that larger symbols are concentrated around major cities, transportation corridors, coastal areas, or particular economic regions.
The map therefore communicates both quantity and geographic distribution.
Graduated Symbols Map Examples
Graduated symbols maps can be used in many real-world situations. The following examples demonstrate how the technique works.
Population by City Map
A map showing population by city could place a circle over each city. The size of each circle would correspond to the city’s population.
Large metropolitan areas would generally have larger symbols, while smaller communities would have smaller symbols.
Agricultural Production Map
A country could be divided into agricultural regions, with graduated symbols representing the amount of wheat produced in each region.
A large symbol would indicate a high production value, while a small symbol would indicate lower production.
Hospital Patient Map
A health-services map could use graduated symbols to show the number of patients served by hospitals in different locations.
Hospitals serving larger numbers of patients could receive larger symbols, making areas of higher service demand easier to identify.
Retail Sales Map
A business map could show sales values for stores across different cities. Larger symbols could represent stores with higher annual sales, while smaller symbols could represent stores with lower sales.
This provides a quick visual comparison of business performance by location.
Graduated Symbols Map in GIS
Graduated symbols are widely used in Geographic Information Systems, or GIS, because GIS software can connect numerical data with geographic locations.
A GIS program can take a dataset containing locations and numerical values and create symbols whose sizes change according to those values.
Using Graduated Symbols in GIS
A typical workflow includes:
- Prepare geographic data with a numerical field.
- Add the dataset to a GIS project.
- Select a graduated or size-based symbol style.
- Choose the numerical attribute used for symbol sizing.
- Select suitable symbol sizes.
- Adjust classification or scaling settings.
- Create and review the map legend.
- Check whether symbols are easy to compare.
- Export or publish the finished map.
The exact tools and terminology can vary between GIS platforms, but the underlying concept remains the same.
Choosing the Right Data
Graduated symbols work best with quantitative data. The attribute being mapped should contain meaningful numerical values that can be compared between locations.
For example, population, revenue, production volume, and number of employees are quantitative variables that can work well with graduated symbols.
Categorical information such as land-use type or political party is generally better represented using different colors or categorical symbols rather than graduated symbol sizes.
Graduated Symbols Map Classification Methods
Classification determines how numerical values are grouped into symbol sizes. Choosing an appropriate classification method can significantly affect how the final map looks.
Equal Interval Classification
Equal interval classification divides the data range into intervals of equal numerical width.
For example, values might be divided into:
- 0–100
- 101–200
- 201–300
- 301–400
Each range receives a different symbol size.
Quantile Classification
Quantile classification places a similar number of observations into each class. This can make the symbols more evenly distributed across the map.
However, the numerical ranges between classes may be very different if the dataset contains unevenly distributed values.
Natural Breaks Classification
Natural breaks classification identifies groups based on natural differences within the data. It can be useful when the dataset contains noticeable gaps between clusters of values.
The goal is to create classes that reflect meaningful divisions within the dataset.
Advantages of Graduated Symbols Maps
Graduated symbols provide several benefits when numerical geographic data needs to be communicated visually.
Easy Visual Comparison
Different symbol sizes allow readers to compare quantities quickly. You do not necessarily need to read every number to understand which locations have higher or lower values.
Good for Point-Based Data
Graduated symbols are particularly useful when the data is associated with specific locations, such as cities, stores, airports, hospitals, or monitoring stations.
Shows Geographic Distribution
A graduated symbols map does more than display numbers. It shows where those numbers occur geographically, allowing users to identify spatial patterns.
Works With Many Data Types
The technique can be applied to demographic, economic, environmental, transportation, agricultural, and business datasets.
Limitations of Graduated Symbols Maps
Although graduated symbols are useful, they are not perfect for every mapping situation.
Large Symbols Can Overlap
When several high-value locations are close together, large symbols can overlap. This can make individual locations difficult to identify.
Symbol Size Can Be Difficult to Estimate
People generally find it easier to compare lengths than areas. Since graduated symbols often change in area, estimating exact differences from symbol size can be challenging.
Poor Classification Can Mislead
If data is grouped into inappropriate classes, important differences may be hidden or exaggerated visually.
Very Large Values Can Dominate the Map
When a dataset contains extreme values, a few very large symbols may overwhelm smaller symbols. Careful scaling and symbol design can help maintain readability.
Graduated Symbols vs Other Thematic Maps
Different thematic mapping techniques are designed for different types of information.
Graduated Symbols vs Choropleth Maps
A graduated symbols map changes symbol size according to numerical values at locations. A choropleth map usually changes the color or shade of geographic areas according to a data value.
Graduated symbols are especially useful for point locations, while choropleth maps are commonly used for area-based statistics.
Graduated Symbols vs Dot Density Maps
Dot density maps use dots to represent quantities or concentrations. Each dot may represent a particular number of items.
Graduated symbols instead use symbol size to communicate the numerical value associated with a location.
Graduated Symbols vs Heat Maps
Heat maps use color intensity or gradients to show concentration or density across an area. Graduated symbols normally use discrete symbols positioned at specific geographic locations.
The best choice depends on the dataset and the message the map needs to communicate.
How to Create a Graduated Symbols Map
Creating a graduated symbols map requires both suitable data and thoughtful map design.
Prepare the Dataset
Make sure each geographic feature has a numerical value. Check for missing values, incorrect entries, and inconsistent units before mapping the information.
Select a Symbol
Choose a simple symbol that remains recognizable at different sizes. Circles are often a practical choice because they are visually simple and easy to place.
Set the Size Range
Choose a minimum and maximum symbol size that provides visible differences without allowing the largest symbols to dominate the entire map.
Create a Clear Legend
The legend should allow readers to connect symbol size with numerical values. Include enough reference symbols to make comparisons useful without making the legend unnecessarily complicated.
Review the Finished Map
Look for overlapping symbols, unclear labels, extreme values, and visual clutter. A technically correct map can still be difficult to understand if the symbols are poorly designed.
Best Practices for Graduated Symbols Maps
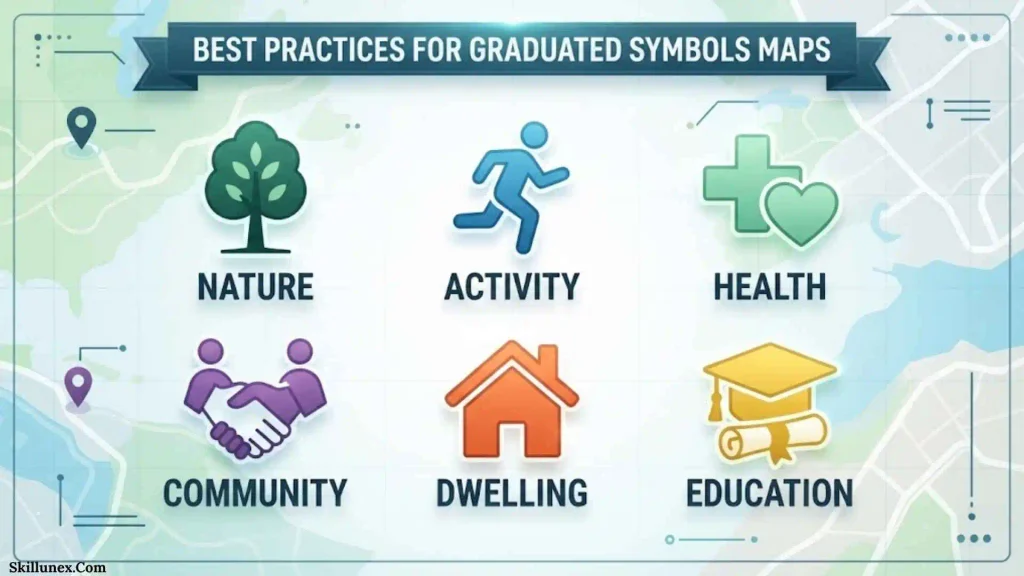
Good map design is important because the symbol sizes carry the main quantitative message.
Use Simple Symbols
Simple geometric symbols are usually easier to compare than complicated illustrations.
Avoid Excessive Symbol Sizes
A huge range between the smallest and largest symbols can make smaller locations nearly invisible. Use a balanced size range.
Provide a Useful Legend
Readers should be able to understand the numerical meaning of the symbols without guessing.
Consider Overlap
If symbols overlap frequently, consider adjusting their sizes, placement, transparency, or labeling.
Use Accurate Data
The map is only as reliable as the underlying data. Always verify units, geographic locations, dates, and numerical values before publishing.
Frequently Asked Questions
What Is a Graduated Symbols Map?
A graduated symbols map is a thematic map that uses symbols of different sizes to represent different numerical values at geographic locations. Larger symbols generally indicate higher values, while smaller symbols indicate lower values.
What Is an Example of a Graduated Symbol Map?
A population-by-city map is a common example. Each city can be represented by a circle whose size corresponds to its population. Cities with larger populations receive larger symbols.
What Is the Difference Between Graduated and Proportional Symbols?
Graduated symbols commonly assign data values to classes and use a limited number of symbol sizes. Proportional symbols can scale symbol size more directly according to individual numerical values. The terminology and implementation can vary depending on the mapping software or cartographic method.
What Data Is Best for Graduated Symbols?
Graduated symbols are best suited to quantitative data associated with specific geographic locations. Examples include population, sales, production, traffic volume, and the number of facilities.
Why Are Circles Commonly Used for Graduated Symbols?
Circles are simple, recognizable, and easy to place on maps. Their size can be changed smoothly to represent different numerical values.
Can Graduated Symbols Be Used in GIS?
Yes. GIS software can use numerical attributes to automatically change symbol sizes and create graduated-symbol maps. This makes the method useful for analyzing and communicating spatial data.
What Does a Larger Symbol Mean on a Graduated Symbols Map?
In most graduated-symbol maps, a larger symbol represents a higher numerical value and a smaller symbol represents a lower value. The map legend should always be checked because it provides the specific meaning for that map.
What Are the Main Problems With Graduated Symbols?
Common problems include symbol overlap, difficulty estimating areas, inappropriate classification, and very large symbols caused by extreme values. Careful cartographic design can reduce these problems.
Conclusion
A graduated symbols map provides a simple visual way to communicate numerical differences across geographic locations. By changing the size of symbols according to data values, it allows readers to compare places and recognize geographic patterns quickly. Population, sales, production, traffic, environmental measurements, and many other types of quantitative information can be represented with this technique.
To create an effective graduated symbols map, focus on accurate data, appropriate symbol sizes, a clear legend, sensible classification, and good overall map design. When these elements work together, graduated symbols can turn complex geographic statistics into information that is much easier to understand and interpret.

I’m Adrian Holloway, a writer and researcher who enjoys exploring the stories, meanings, and interesting facts behind the subjects people search for every day. I’m especially interested in symbols, nature, lakes, places, and cultural topics that help readers understand the world from a different perspective.
I believe useful content should be simple, accurate, and enjoyable to read. When I research a topic, I focus on finding meaningful details and presenting them in a way that makes information easy to understand.
My goal is to create helpful articles that answer real questions while encouraging readers to discover something new with every visit.
Books by Adrian Holloway
The Language of Symbols: Meanings, Stories & Traditions
Hidden Wonders of Nature: Lakes, Landscapes & Discovery