Have you ever looked at a statistics formula and wondered what σ, s, or SD actually means? If you are learning statistics, these symbols can seem confusing at first, especially because population and sample standard deviation use different notation. Once you understand what each symbol represents, however, the formulas become much easier to read and apply.
In this guide, I’ll explain the most common symbols for standard deviation, including σ (sigma) for population standard deviation and s for sample standard deviation. You’ll also learn what SD, σ², s², μ, x̄, n, N, Σ, and xᵢ mean, how the formulas differ, how to calculate standard deviation step by step, and how you can recognize the correct symbol in statistics questions.
Quick Answer: What Is The Symbol For Standard Deviation?
The standard deviation symbol depends on whether you are describing a population or a sample.
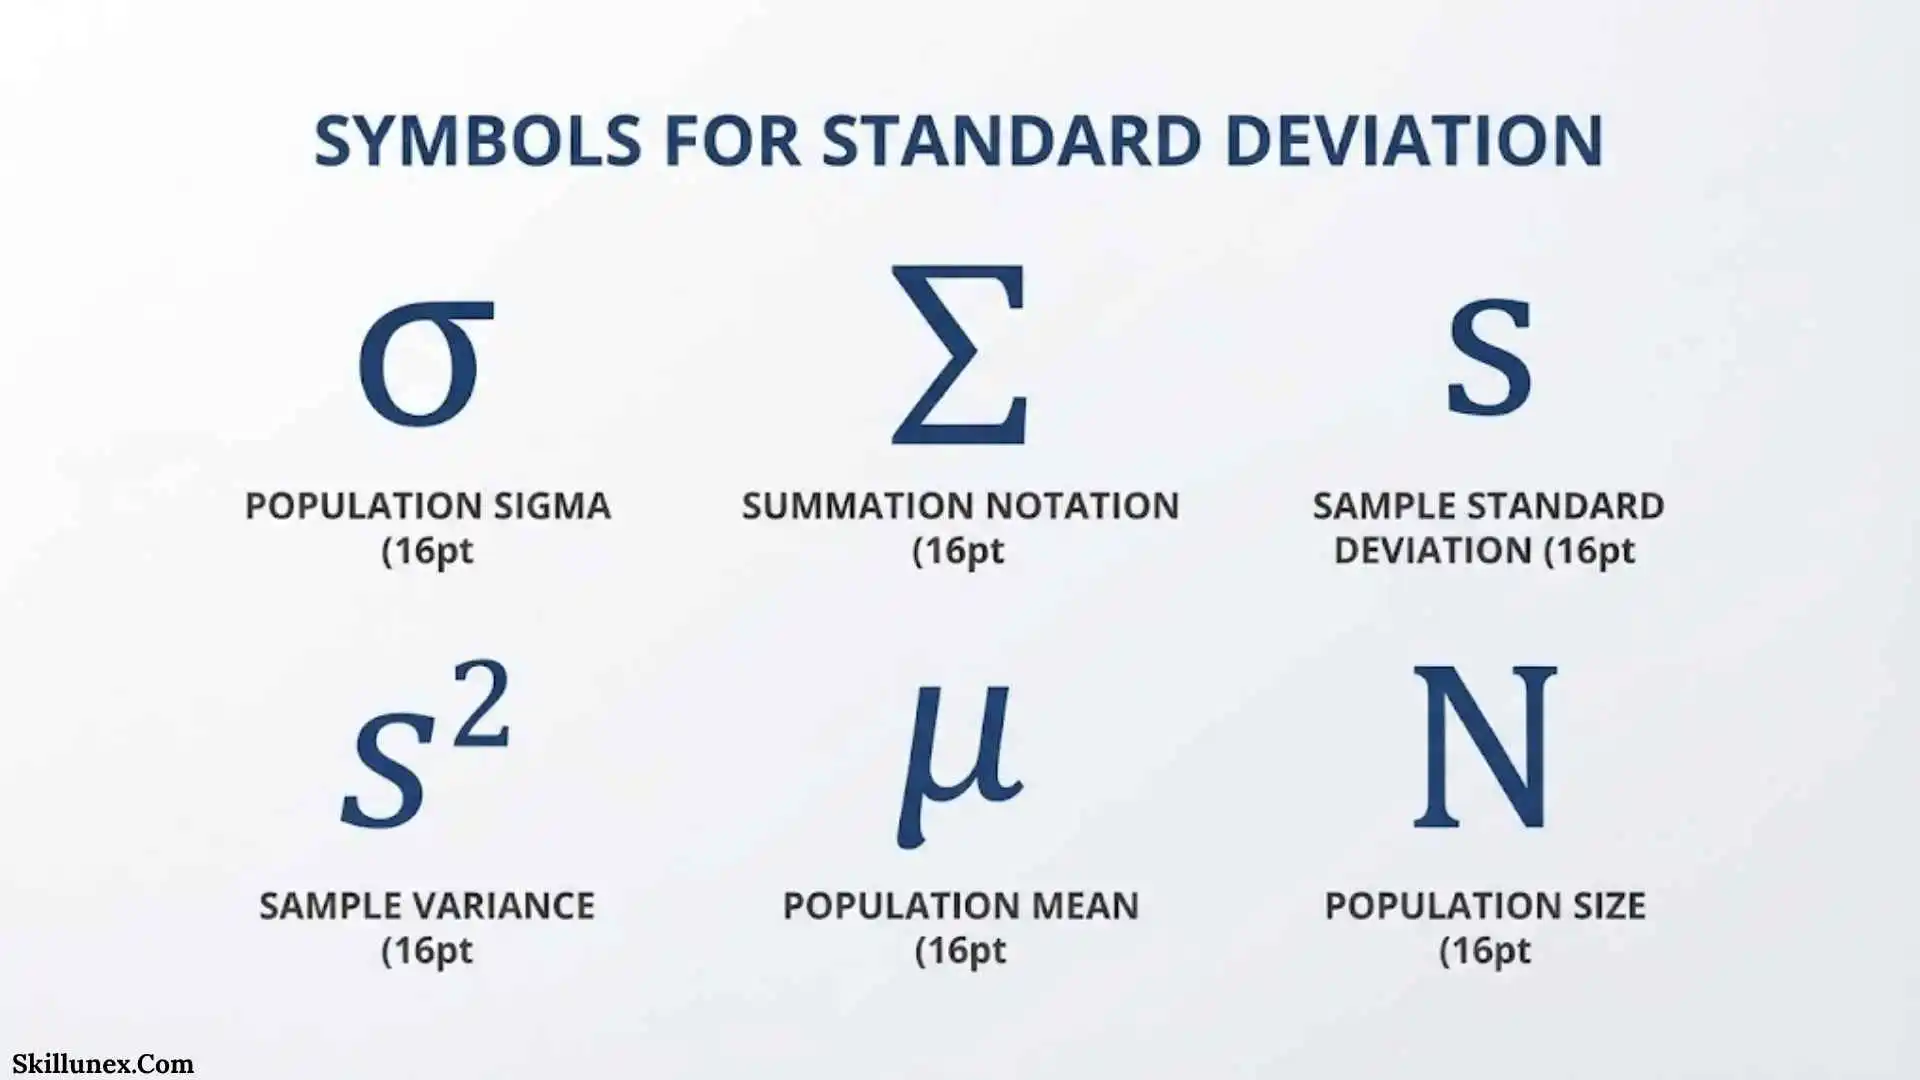
- σ (sigma) = population standard deviation
- s = sample standard deviation
- SD = general abbreviation for standard deviation
- σ² = population variance
- s² = sample variance
A simple way to remember the main distinction is:
Population → σ
Sample → s
This notation is widely used in introductory statistics and statistical formulas.
What Is Standard Deviation?
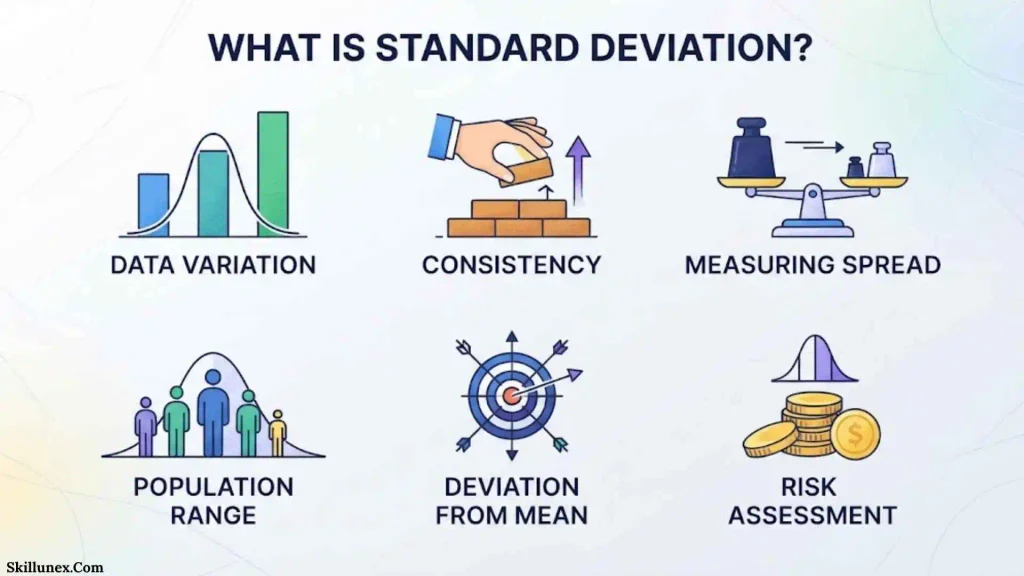
Standard deviation is a measure of how much individual values vary around their mean.
If the values in a dataset are close to the average, the standard deviation is relatively small. If the values are spread far from the average, the standard deviation is larger.
For example, consider these two datasets:
Dataset A: 48, 49, 50, 51, 52
Dataset B: 20, 35, 50, 65, 80
Both datasets have a mean of 50, but Dataset B has much greater variation.
That difference is what standard deviation helps you describe.
Why Standard Deviation Is Important
You can encounter standard deviation in:
- Statistics
- Mathematics
- Science
- Psychology
- Economics
- Finance
- Education
- Medicine
- Business
- Research
- Data analysis
When you understand the standard deviation symbol, you can interpret statistical tables and formulas much more confidently.
What Does A Large Standard Deviation Mean?
A larger standard deviation generally means that observations are more dispersed around the mean.
For example, if two groups have the same average test score but one group has a larger standard deviation, that group has greater variation in its scores.
What Does A Small Standard Deviation Mean?
A smaller standard deviation means that observations are generally closer to their mean.
This does not automatically mean the data are “better.” It simply describes less variation in the particular dataset.
The Main Symbols For Standard Deviation
The two symbols you should know first are σ and s.
| Symbol | Meaning | Used For |
| σ | Population standard deviation | Entire population |
| s | Sample standard deviation | Sample from a population |
| SD | Standard deviation | General abbreviation |
| σ² | Population variance | Entire population |
| s² | Sample variance | Sample |
The distinction between σ and s is fundamental in statistics.
What Does σ Mean?
The lowercase Greek letter σ, called sigma, represents the population standard deviation.
You use σ when your data represent the entire population you are studying.
For example, if a school has exactly 500 students and you calculate the standard deviation using the test scores of all 500 students, you are working with the population.
The standard deviation is therefore represented as:
σ
What Does s Mean?
The lowercase letter s commonly represents the sample standard deviation.
You use s when you have only part of a larger population.
For example, imagine a university has 20,000 students but you collect data from 500 students. Those 500 students are a sample.
The standard deviation calculated from those observations is commonly represented as:
s
What Does SD Mean?
SD is simply an abbreviation for standard deviation.
You may see it in:
- Research papers
- Statistical tables
- Academic reports
- Surveys
- Scientific studies
- Data summaries
For example:
Mean = 72, SD = 8
This tells you that the reported standard deviation is 8.
However, SD by itself does not necessarily tell you whether the calculation refers to a population or a sample. You need to examine the context.
Population Standard Deviation Symbol σ
The symbol σ represents population standard deviation.
The commonly used formula is:
σ = √[Σ(x − μ)² / N]
Here is what each part means:
- σ = population standard deviation
- Σ = sum of
- x = individual value
- μ = population mean
- N = population size
This formula calculates the spread of all observations around the population mean.
When Should You Use σ?
You generally use σ when the dataset contains the entire population of interest.
For example:
A company has 100 employees, and you calculate the standard deviation of the salaries of all 100 employees.
If those 100 employees constitute the complete population being studied, the population standard deviation is represented by σ.
Population Standard Deviation Formula
The formula can also be written with indexed observations:
σ = √[Σ(xᵢ − μ)² / N]
The subscript i identifies individual observations.
This notation is especially common in more formal statistical writing.
Sample Standard Deviation Symbols
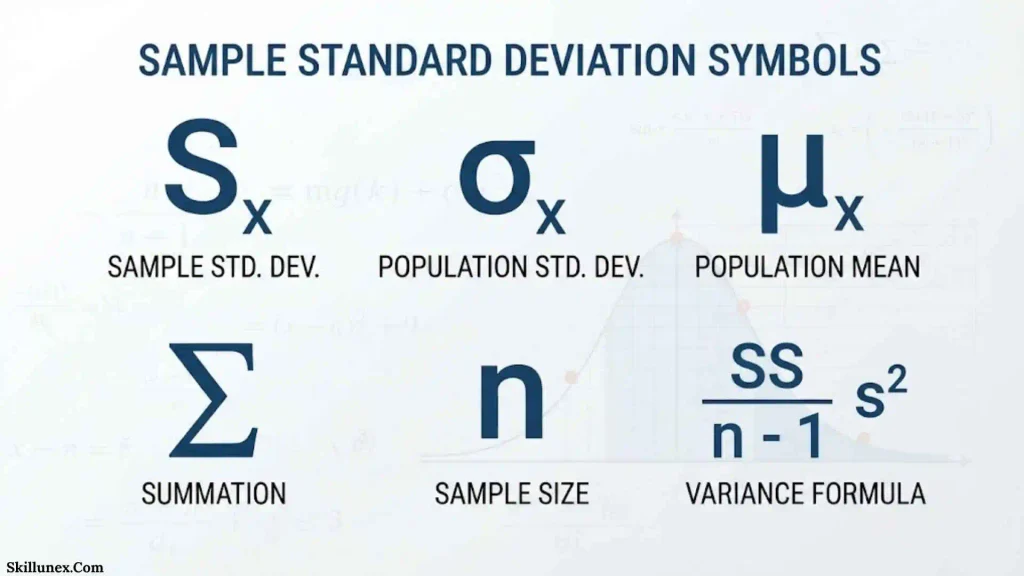
The symbol s represents sample standard deviation.
The commonly used formula is:
s = √[Σ(x − x̄)² / (n − 1)]
Here:
- s = sample standard deviation
- Σ = sum of
- x = individual observation
- x̄ = sample mean
- n = sample size
The sample formula uses n − 1 in the denominator rather than n.
When Should You Use s?
You use s when your observations represent a sample from a larger population.
For example:
You want to study the average height of all students at a university, but you measure only 200 students.
Those 200 students are a sample, so the sample standard deviation is commonly represented by s.
Why Does The Sample Formula Use n − 1?
The n − 1 denominator is commonly called Bessel’s correction.
The reason is that the sample mean is estimated from the same sample. Using n − 1 provides the conventional unbiased estimator of the population variance under the usual assumptions.
You should therefore avoid automatically using the population formula whenever you see a list of numbers. First determine whether those numbers represent the complete population or a sample.
Population vs Sample Standard Deviation
The easiest way to understand the notation is to compare the two side by side.
| Feature | Population | Sample |
| Standard deviation | σ | s |
| Mean | μ | x̄ |
| Size | N | n |
| Variance | σ² | s² |
| Common denominator | N | n − 1 |
This distinction is standard statistical notation.
Population Notation
For a population, you commonly see:
μ, σ, σ², N
These represent:
- Population mean
- Population standard deviation
- Population variance
- Population size
Sample Notation
For a sample, you commonly see:
x̄, s, s², n
These represent:
- Sample mean
- Sample standard deviation
- Sample variance
- Sample size
A useful memory trick is:
Greek symbols → commonly population parameters
Latin symbols → commonly sample statistics
This convention is widely used, although specific fields and texts can sometimes use additional notation.
Other Symbols Used In Standard Deviation Formulas
Knowing σ and s is important, but you also need to understand the symbols around them.
μ — Population Mean
The Greek letter μ (mu) represents the population mean.
The population mean is:
μ = Σx / N
You use μ when calculating the average of the entire population.
x̄ — Sample Mean
The symbol x̄, pronounced “x-bar,” represents the sample mean.
It is calculated as:
x̄ = Σx / n
You use x̄ when the data represent a sample.
xᵢ — Individual Observation
The notation xᵢ represents an individual observation in a dataset.
The subscript i identifies which observation you are referring to.
For example:
x₁, x₂, x₃, x₄
represent the first, second, third, and fourth observations.
N — Population Size
N generally represents the number of observations in a population.
If a population contains 1,000 observations:
N = 1000
n — Sample Size
n generally represents the number of observations in a sample.
If your sample contains 100 observations:
n = 100
Σ — Summation Symbol
The uppercase Greek letter Σ means summation.
For example:
Σx
means to add the relevant x values.
Do not confuse Σ with σ.
They both come from the Greek letter sigma, but they have different meanings.
σ vs Σ: What Is The Difference?
This is one of the most common notation questions.
σ = population standard deviation
Σ = summation
The difference is important.
For example:
σ = √[Σ(x − μ)² / N]
In this formula:
- σ tells you what quantity you are calculating.
- Σ tells you to add the squared deviations.
If you are confused by the symbols, look carefully at their capitalization.
Lowercase σ and uppercase Σ are not interchangeable.
Variance vs Standard Deviation Symbols
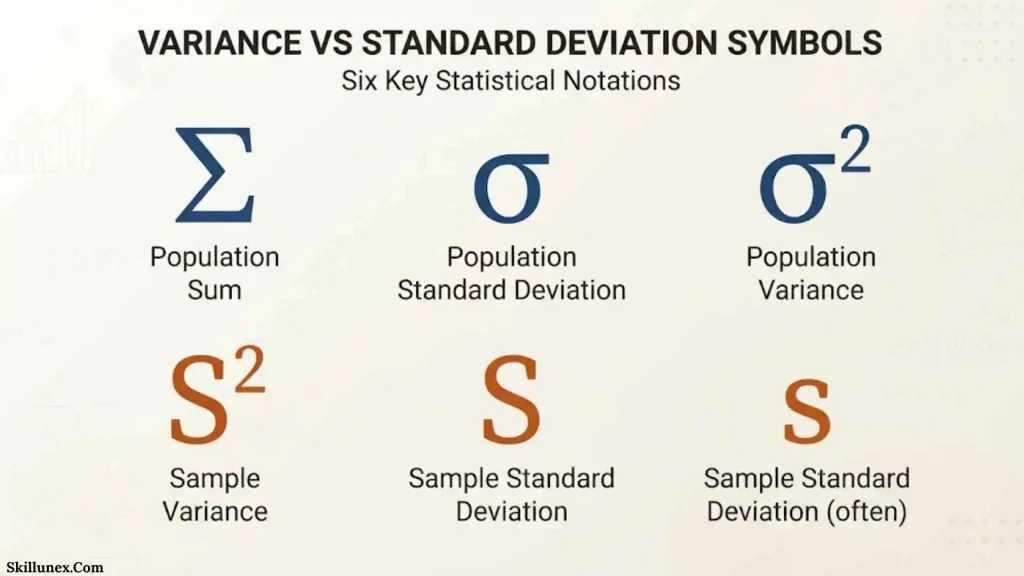
Variance and standard deviation are closely connected.
For populations:
σ² = population variance
σ = population standard deviation
For samples:
s² = sample variance
s = sample standard deviation
Standard deviation is the square root of variance.
Population Variance σ²
Population variance is represented by:
σ²
The formula is:
σ² = Σ(x − μ)² / N
Then:
σ = √σ²
Sample Variance s²
Sample variance is represented by:
s²
The common formula is:
s² = Σ(x − x̄)² / (n − 1)
Then:
s = √s²
Why Is Standard Deviation Easier To Interpret?
Variance is expressed in squared units, while standard deviation is expressed in the same units as the original observations.
For example, if your measurements are in centimeters, the standard deviation is in centimeters, while variance is in square centimeters.
This is one reason standard deviation is often easier to interpret directly. NIST likewise distinguishes variance from standard deviation and notes that standard deviation remains in the units of the measured quantity.
How To Calculate Population Standard Deviation
Let’s work through a simple example so you can see exactly how the symbol and formula are used.
Suppose the population is:
2, 4, 6, 8, 10
Step 1: Find The Population Mean
Add the values:
2 + 4 + 6 + 8 + 10 = 30
There are five values:
N = 5
Therefore:
μ = 30 / 5 = 6
Step 2: Find Each Deviation
Subtract the mean from each value:
| x | x − μ |
| 2 | −4 |
| 4 | −2 |
| 6 | 0 |
| 8 | 2 |
| 10 | 4 |
Step 3: Square The Deviations
The squared deviations are:
16, 4, 0, 4, 16
Their sum is:
40
Step 4: Divide By N
Because this is the complete population:
40 / 5 = 8
Step 5: Take The Square Root
σ = √8 ≈ 2.83
So:
Population standard deviation ≈ 2.83
This follows the population formula, which divides by N.
How To Calculate Sample Standard Deviation
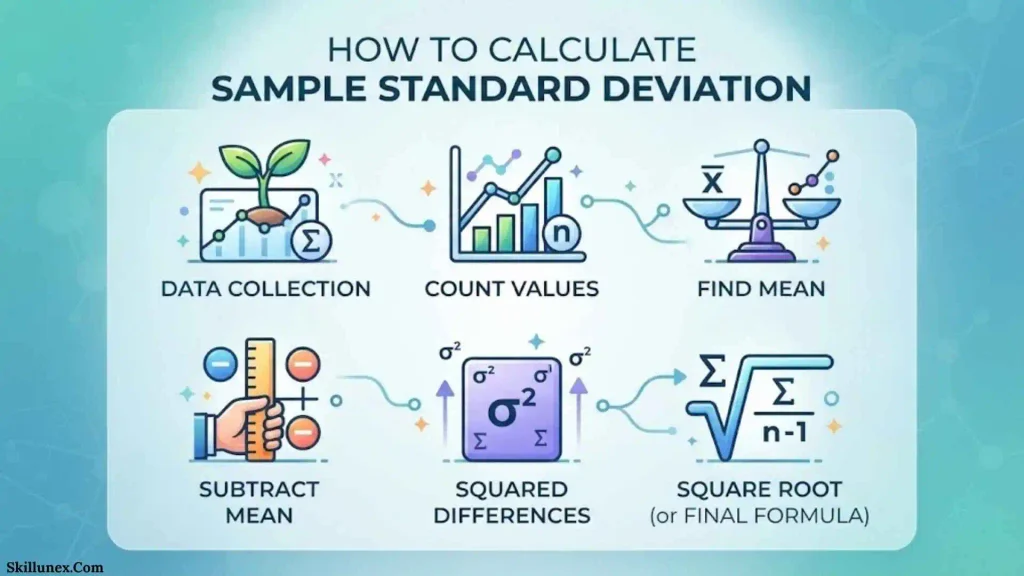
Now imagine the same numbers are treated as a sample:
2, 4, 6, 8, 10
The sample mean is still:
x̄ = 6
The squared deviations still total:
40
But because this is a sample, the denominator is:
n − 1
Since:
n = 5
we have:
n − 1 = 4
Calculate The Sample Variance
40 / 4 = 10
Take The Square Root
s = √10 ≈ 3.16
Therefore:
Sample standard deviation ≈ 3.16
Notice that the same five numbers produced different standard deviations because the statistical context was different.
Why Population And Sample Standard Deviation Give Different Answers
You may wonder why the answer changes when the numbers themselves do not.
The reason is that the two calculations answer different statistical questions.
The population calculation asks:
How much do all values in this population vary around their population mean?
The sample calculation asks:
How much do the observations in this sample vary, using a calculation designed to estimate population variability?
The formulas therefore use different denominators and different notation.
Standard Deviation Symbols On Calculators
If you use a scientific or graphing calculator, you may see more specific notation.
Common labels include:
- σx
- Sx
- sx
- σ
- s
The exact labels depend on the calculator.
σx
On many calculators, σx refers to population standard deviation.
Sx or sx
On many calculators, Sx or sx refers to sample standard deviation.
You should still check your calculator’s documentation because notation can vary between models.
Why Calculator Results Can Confuse You
Suppose you enter the same dataset and your calculator gives two answers.
That does not necessarily mean one calculation is wrong.
You may simply be looking at:
σx → population standard deviation
and
Sx → sample standard deviation
Always identify which option you selected before reporting your answer.
Standard Deviation Symbols In Excel
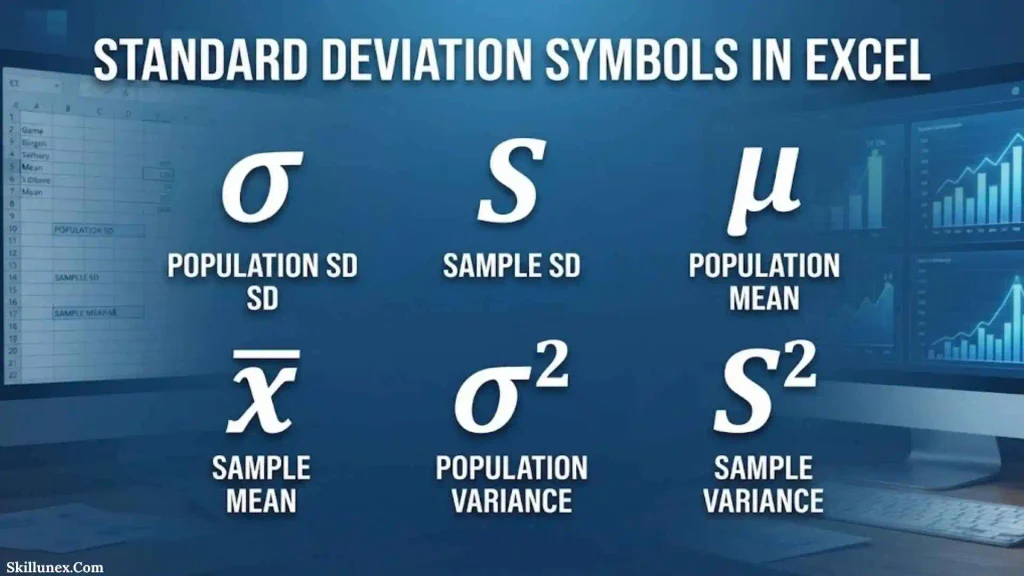
Spreadsheet programs also distinguish population and sample standard deviation.
In Microsoft Excel, commonly used functions include:
STDEV.P → population standard deviation
STDEV.S → sample standard deviation
The letters P and S make the distinction easier to remember.
When To Use STDEV.P
Use STDEV.P when your data represent the entire population you want to describe.
When To Use STDEV.S
Use STDEV.S when your data are a sample used to estimate a larger population.
If you are unsure, first ask yourself:
Am I describing everyone in my target population, or only a sample?
That question usually tells you which approach you need.
Standard Deviation Symbols In Python And R
If you work with programming languages, you may also encounter different defaults.
For example, NumPy’s std() function uses population-style calculation by default, while setting ddof=1 produces the common sample standard deviation calculation. In R, the sd() function is used for sample standard deviation.
This matters because you can get different results from different tools if you do not know which definition they are using.
Why Software Settings Matter
When you use software, do not assume that every standard deviation function uses the same denominator.
Before reporting your result, check whether the calculation uses:
N
or
n − 1
This small detail can matter when accuracy is important.
Standard Deviation In Research Tables
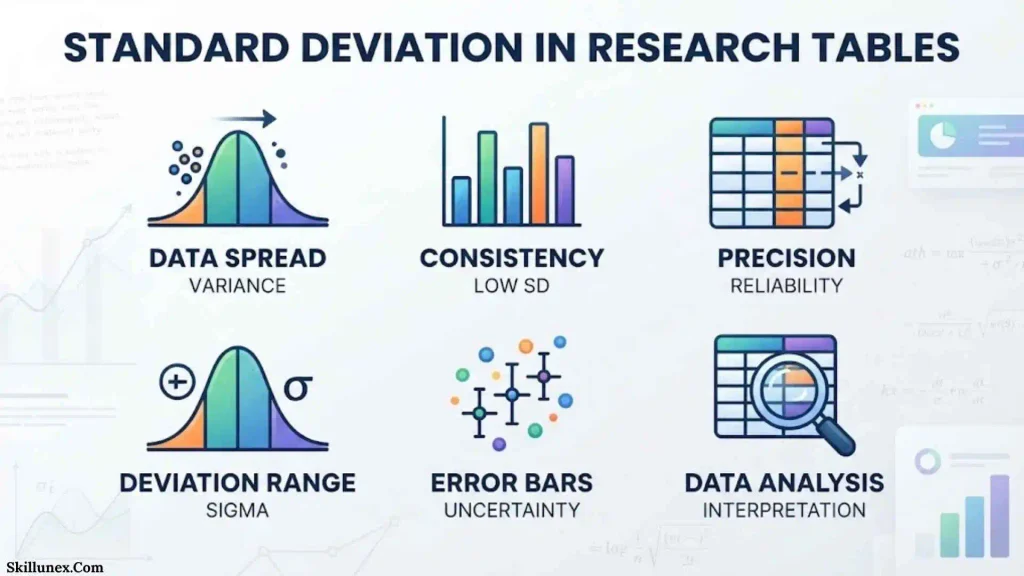
You may often see standard deviation reported alongside a mean.
For example:
Mean = 75.4
SD = 6.2
This means the dataset has a reported mean of 75.4 and a standard deviation of 6.2.
However, you should look at the study’s methods or table notes to determine whether the reported SD is a sample statistic and how it was calculated.
Mean ± SD
Research papers sometimes use a format such as:
75.4 ± 6.2
If the paper states that values are reported as mean ± SD, then:
- 75.4 = mean
- 6.2 = standard deviation
You should not assume that every use of the ± symbol automatically means mean ± SD. Always check the accompanying description.
Standard Deviation And The Normal Distribution
Standard deviation is particularly important when working with a normal distribution.
In a normal distribution, σ determines the spread of the distribution around the mean.
A smaller standard deviation produces a narrower distribution.
A larger standard deviation produces a wider distribution.
The 68–95–99.7 Rule
For an approximately normal distribution:
- About 68% of observations are within 1 standard deviation of the mean.
- About 95% are within 2 standard deviations.
- About 99.7% are within 3 standard deviations.
This is known as the empirical rule.
You should remember that this rule applies to approximately normal distributions, not automatically to every dataset.
Standard Deviation And Z Scores
Standard deviation also appears in the z-score formula.
For a population-based z-score:
z = (x − μ) / σ
Where:
- z = z-score
- x = observation
- μ = population mean
- σ = population standard deviation
The z-score tells you how many standard deviations an observation is from the mean.
Positive Z Score
A positive z-score means the observation is above the mean.
For example:
z = +2
means the observation is two standard deviations above the mean.
Negative Z Score
A negative z-score means the observation is below the mean.
For example:
z = −1
means the observation is one standard deviation below the mean.
Standard Deviation And Standard Error Are Not The Same
This is an important distinction that many students miss.
Standard deviation describes the variability of individual observations.
Standard error describes the variability of a sample statistic, such as the sample mean, across repeated samples.
For the sample mean, a commonly used standard error is:
SE = s / √n
So you should not treat SD and SE as interchangeable.
SD
SD → spread of observations
SE
SE → uncertainty/variability of an estimated statistic
If you see both in a research paper, read the table headings carefully.
Common Mistakes With Standard Deviation Symbols
Even when you understand the basic formulas, several notation mistakes are common.
Confusing σ And Σ
Remember:
σ = population standard deviation
Σ = summation
They look related because both are sigma symbols, but their functions are completely different.
Confusing σ And s
Remember:
σ → population
s → sample
Using n Instead Of n − 1 For A Sample
The common sample standard deviation formula uses:
n − 1
not:
n
when estimating population variance from sample data.
Using μ For A Sample Mean
The conventional notation is:
μ → population mean
x̄ → sample mean
Assuming SD Always Means σ
SD is a general abbreviation. It does not necessarily specify whether the standard deviation is a population parameter or sample statistic.
Forgetting To Check Calculator Settings
Your calculator may display both population and sample standard deviations.
If you choose the wrong option, you can obtain a different result even though your arithmetic is correct.
How To Identify The Correct Standard Deviation Symbol
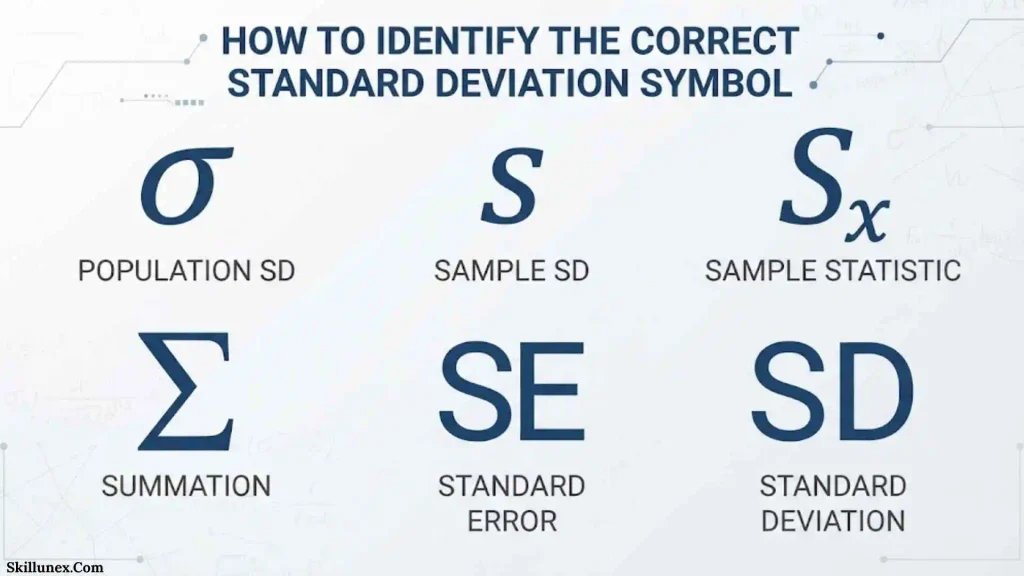
If you are given a statistics problem, use this simple process.
Step 1: Identify The Data
Ask:
Do these numbers represent the entire population?
If yes, think about σ.
Step 2: Look For Sampling Language
Words such as:
- Sample
- Random sample
- Selected participants
- Survey sample
- Subset
- Observations from a larger population
usually indicate that you are dealing with sample data.
Then think about s.
Step 3: Check The Mean Symbol
If the problem gives:
μ
it is referring to a population mean.
If it gives:
x̄
it is referring to a sample mean.
Step 4: Check The Denominator
Population:
N
Sample:
n − 1
Step 5: Check The Context
If the problem is from a textbook, calculator, spreadsheet, or research paper, look at the notation being used throughout the source.
This prevents you from choosing a formula based only on the appearance of the numbers.
Standard Deviation Symbol Cheat Sheet
Here is a quick reference you can save:
| Symbol | Pronunciation | Meaning |
| σ | Sigma | Population standard deviation |
| s | s | Sample standard deviation |
| SD | S-D | Standard deviation |
| σ² | Sigma squared | Population variance |
| s² | s squared | Sample variance |
| μ | Mu | Population mean |
| x̄ | x-bar | Sample mean |
| xᵢ | x-sub-i | Individual observation |
| N | N | Population size |
| n | n | Sample size |
| Σ | Capital sigma | Summation |
| σx | Sigma x | Often population SD on calculators |
| Sx / sx | S-x | Often sample SD on calculators |
| SE | S-E | Standard error |
This notation aligns with common statistical conventions, although particular textbooks, software packages, or fields may introduce variations.
Population And Sample Formula Comparison
| Measure | Population | Sample |
| Mean | μ | x̄ |
| Standard deviation | σ | s |
| Variance | σ² | s² |
| Number of values | N | n |
| Deviation | x − μ | x − x̄ |
| Common variance denominator | N | n − 1 |
The distinction between population and sample notation is one of the most important ideas to understand when learning standard deviation.
Frequently Asked Questions About Symbols For Standard Deviation
What Is The Symbol For Standard Deviation?
The most common symbols are σ for population standard deviation and s for sample standard deviation. SD is also widely used as an abbreviation for standard deviation.
What Does σ Mean In Statistics?
σ represents the population standard deviation. It measures how much the values in an entire population vary around the population mean.
What Does s Mean In Statistics?
s commonly represents the sample standard deviation. It is calculated from sample data and is often used to estimate population variability.
What Is The Difference Between σ And s?
The main difference is the type of data being described. σ represents population standard deviation, while s represents sample standard deviation.
What Does SD Stand For?
SD stands for standard deviation. You will commonly see it in research papers, statistical tables, academic reports, and data summaries.
What Is The Symbol For Population Standard Deviation?
The standard symbol is the lowercase Greek letter σ, pronounced sigma.
What Is The Symbol For Sample Standard Deviation?
The commonly used symbol is the lowercase letter s.
What Is The Symbol For Variance?
σ² commonly represents population variance, while s² commonly represents sample variance.
What Does Σ Mean In A Standard Deviation Formula?
The uppercase Greek letter Σ means summation. It tells you to add the specified values or terms together.
Why Does Sample Standard Deviation Use n − 1?
The common sample variance calculation uses n − 1 because the sample mean is estimated from the same observations. This adjustment is known as Bessel’s correction and is used in the conventional unbiased estimator of population variance.
Is σ The Same As SD?
Not always. σ specifically denotes population standard deviation in conventional notation, while SD is a general abbreviation. You need the context to know whether an SD refers to a population or sample calculation.
Is s The Same As Standard Deviation?
s commonly means sample standard deviation. It is one particular notation for standard deviation rather than a universal replacement for σ.
What Is σ²?
σ² represents population variance. Population standard deviation is the square root of population variance:
σ = √σ²
What Is s²?
s² represents sample variance. Sample standard deviation is its square root:
s = √s²
What Is The Difference Between Standard Deviation And Variance?
Standard deviation is the square root of variance. Variance is expressed in squared units, while standard deviation is expressed in the same units as the original data.
What Does x̄ Mean?
x̄, pronounced “x-bar,” represents the sample mean.
What Does μ Mean?
μ, pronounced “mu,” represents the population mean.
What Does n Mean In Standard Deviation?
n usually represents the number of observations in a sample.
What Does N Mean In Standard Deviation?
N commonly represents the number of observations in a population.
What Does xᵢ Mean?
xᵢ represents an individual observation, with the subscript i identifying its position in the dataset.
What Is The Difference Between SD And SE?
SD describes variability among individual observations, while SE describes the variability or uncertainty of an estimated statistic, such as a sample mean.
Which Standard Deviation Formula Should I Use?
If your dataset represents the entire population, use the population standard deviation formula with σ and N. If it is a sample used to represent a larger population, use the common sample formula with s and n − 1.
Conclusion
Understanding the symbols for standard deviation becomes much easier when you first identify whether you are working with a population or a sample. The most important relationship to remember is σ = population standard deviation and s = sample standard deviation. You will also encounter SD as a general abbreviation, σ² and s² for variance, μ and x̄ for population and sample means, and Σ for summation. Once you recognize these symbols, you can read standard deviation formulas much more confidently.
I hope this guide makes statistics less confusing for you. When I solve a standard deviation problem, I first identify the dataset, determine whether it represents a population or sample, and then choose the matching notation and formula. If you remember population → σ and sample → s, you have the key distinction needed to understand most standard deviation notation.

I’m Adrian Holloway, a writer and researcher who enjoys exploring the stories, meanings, and interesting facts behind the subjects people search for every day. I’m especially interested in symbols, nature, lakes, places, and cultural topics that help readers understand the world from a different perspective.
I believe useful content should be simple, accurate, and enjoyable to read. When I research a topic, I focus on finding meaningful details and presenting them in a way that makes information easy to understand.
My goal is to create helpful articles that answer real questions while encouraging readers to discover something new with every visit.
Books by Adrian Holloway
The Language of Symbols: Meanings, Stories & Traditions
Hidden Wonders of Nature: Lakes, Landscapes & Discovery